Know what your distributionnetwork actually sold.
Not what left your warehouse.
Omni Xtract turns the statements your distributors already send into verified secondary sales data. No software for them to install, and no dependence on what the field force chooses to report.
- 12,000+
- distributors processed every month
- 99.5%
- accuracy across every billing format
- 95%
- of products mapped automatically
Running for a growing list of pharma manufacturers, including Alkem, Sanofi, Indoco, Gufic and Medley.
The structural blind spot
You only see the first step.
- Visible
Your warehouse
- Unseen
Distributor
- Unseen
Sub-stockist
- Unseen
Retailer
- Scheme leakage
- Trade margins miss the tier they were meant for, and you find the slippage after the quarter has closed.
- Stock dumping
- Distributors sit on stock while shelves downstream run empty, so reorders drop before the signal reaches you.
- Unreliable field data
- Manual reporting is delayed, selective and target-shaped. It is not a clean view of what is moving.
Primary sales tell you what left the warehouse. They tell you nothing about what the market took.
Document AI
Any format in. Verified rows out.
Statements arrive as Tally exports, photographed PDFs, spreadsheets and WhatsApp forwards. No two distributors send the same shape. That is the hard part, and it is the part we automated.
What arrives
What comes out
opening + received = sales + closing
Fails the formula. Never enters the data set.
- 01
Sender resolved
Each statement is matched to a distributor by email, GST number and the content of the file itself.
- 02
Columns identified
Layouts differ by billing software, so columns are recognised rather than expected in fixed positions.
- 03
Products mapped
Entries are mapped to your company codes. Around 95% map automatically, and the rest are flagged for review.
- 04
Territory attributed
PTS is validated and every record is attributed to the territory hierarchy a manager actually owns.
- 05
The gate
Every file is tested before anything reaches your reporting layer. Records are compared against previous months, and files with bad validity are rejected.
Out of the box
Built for decision-making.
Everything needed to run a distribution network, available from day one. No custom build, no BI project.
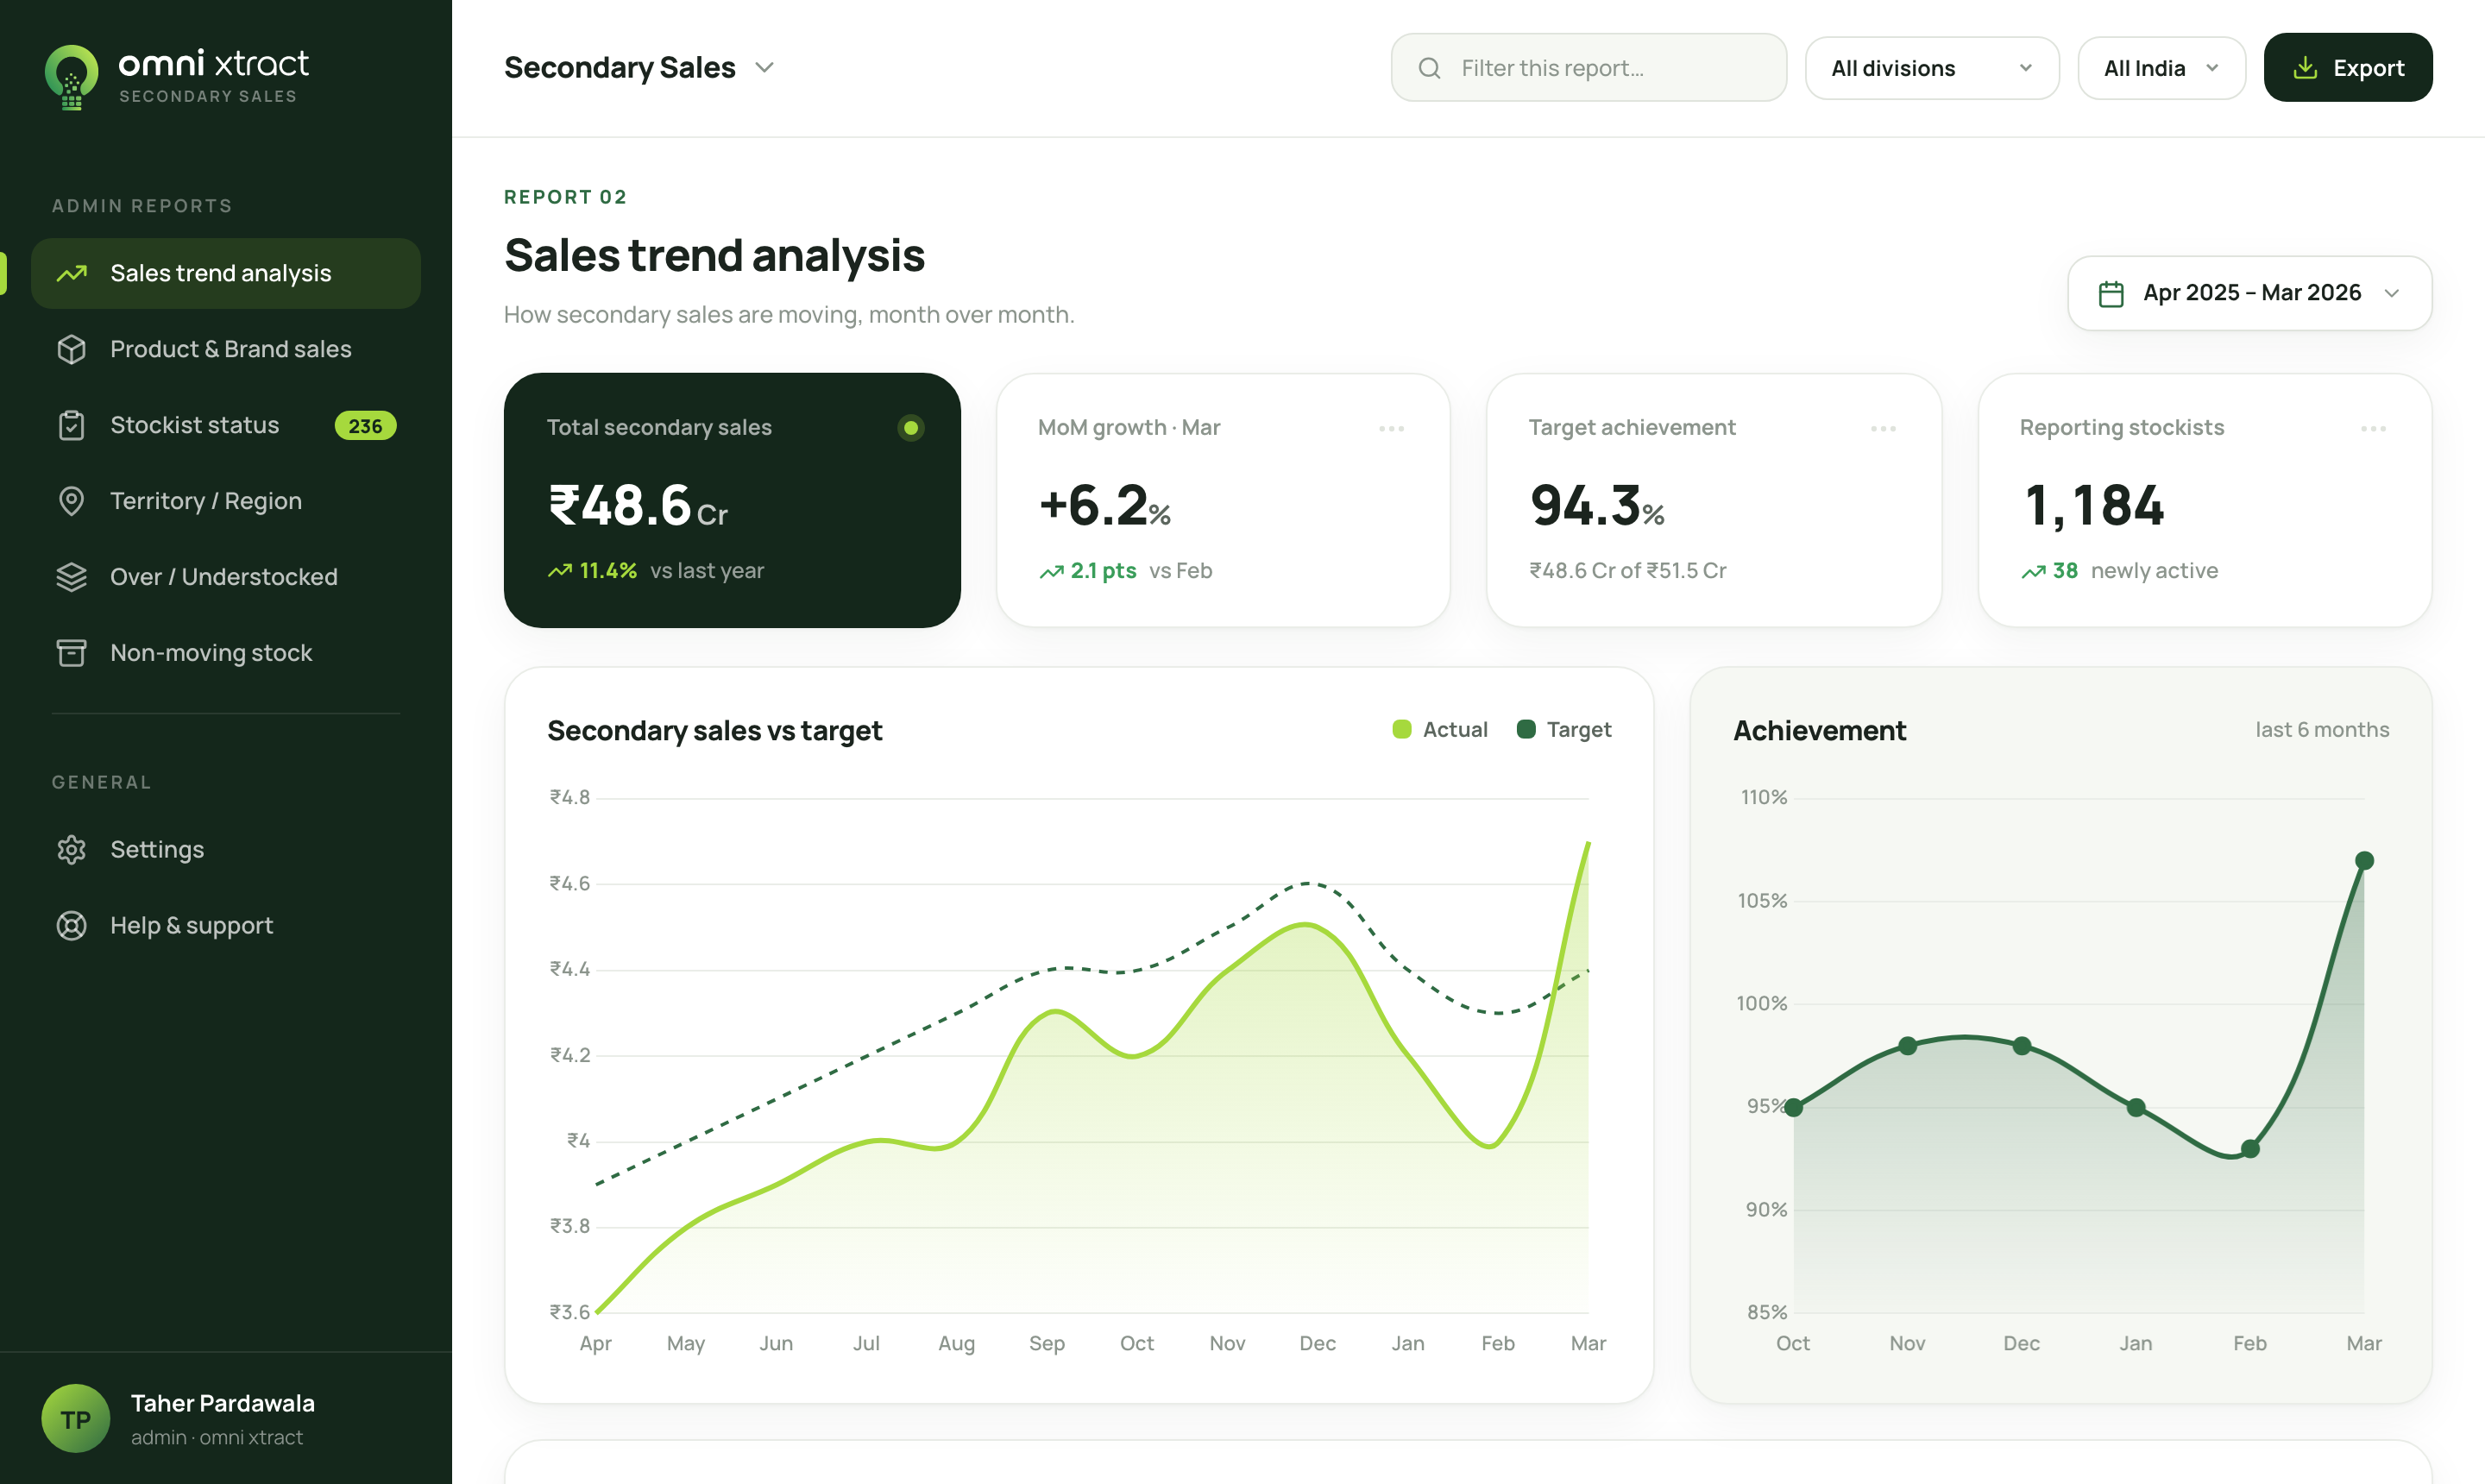
Sales trend analysis
How secondary sales are moving month over month, against target.
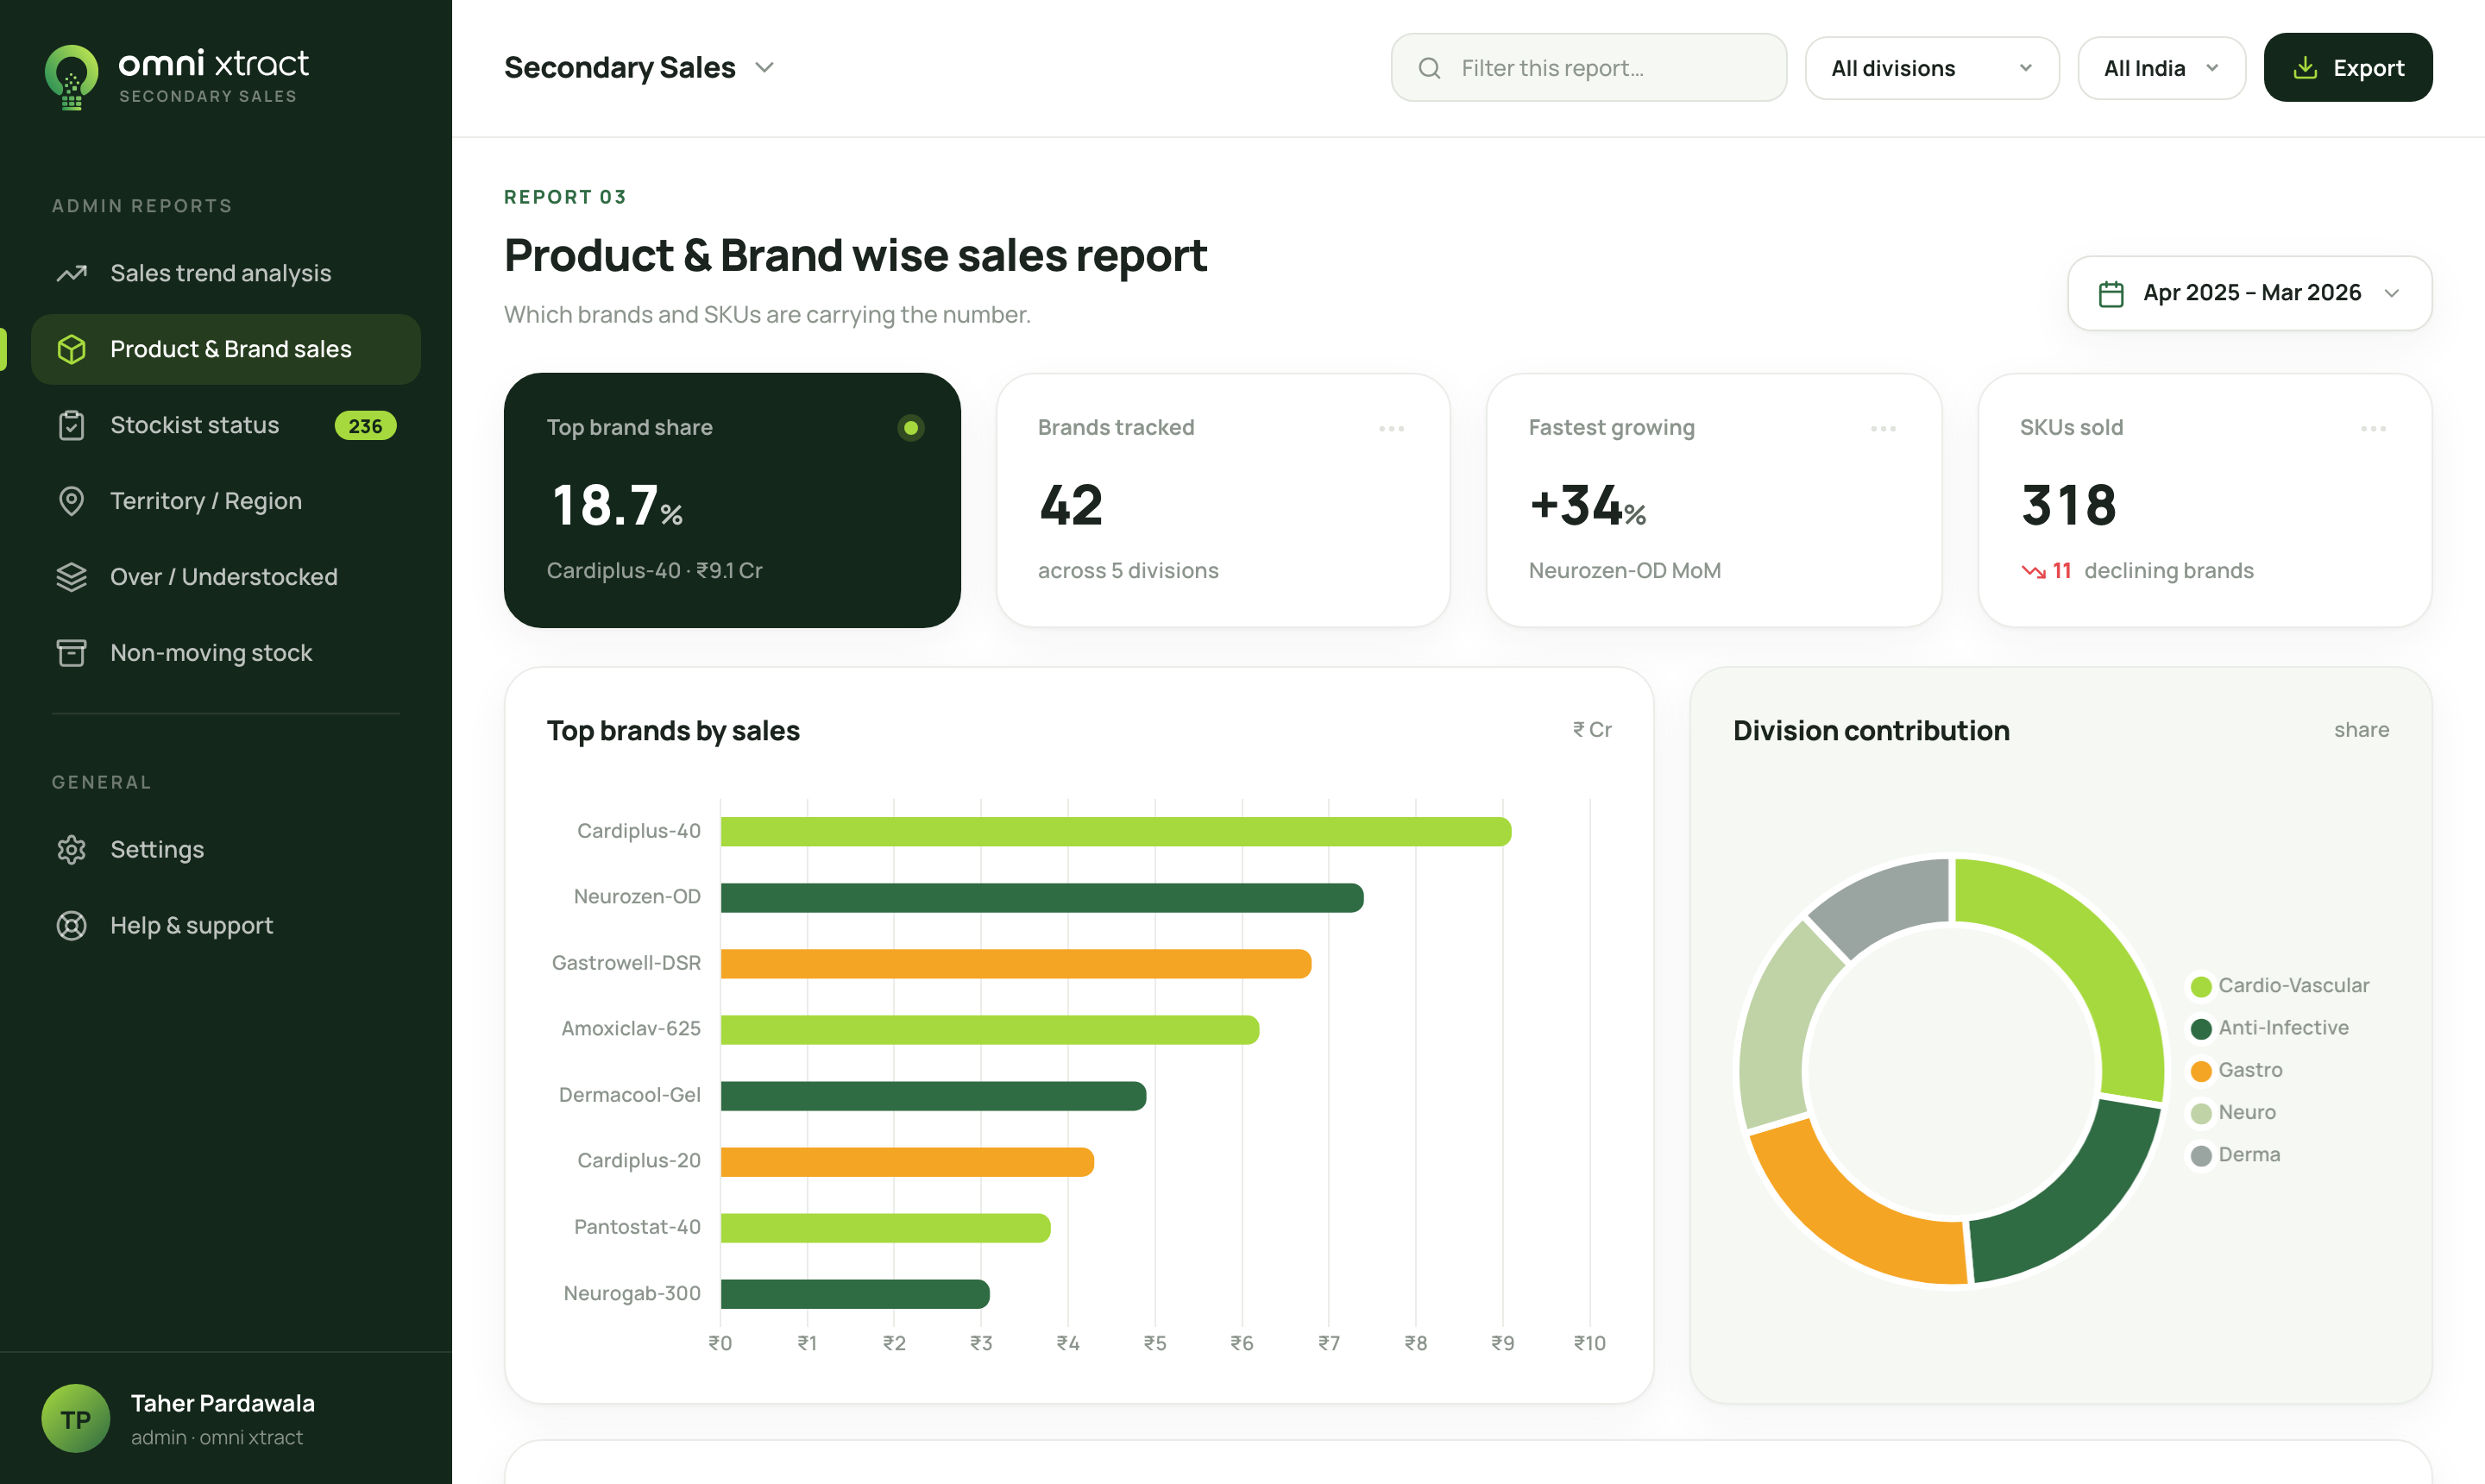
Product and brand sales
What is actually selling, by product, brand and division mix.
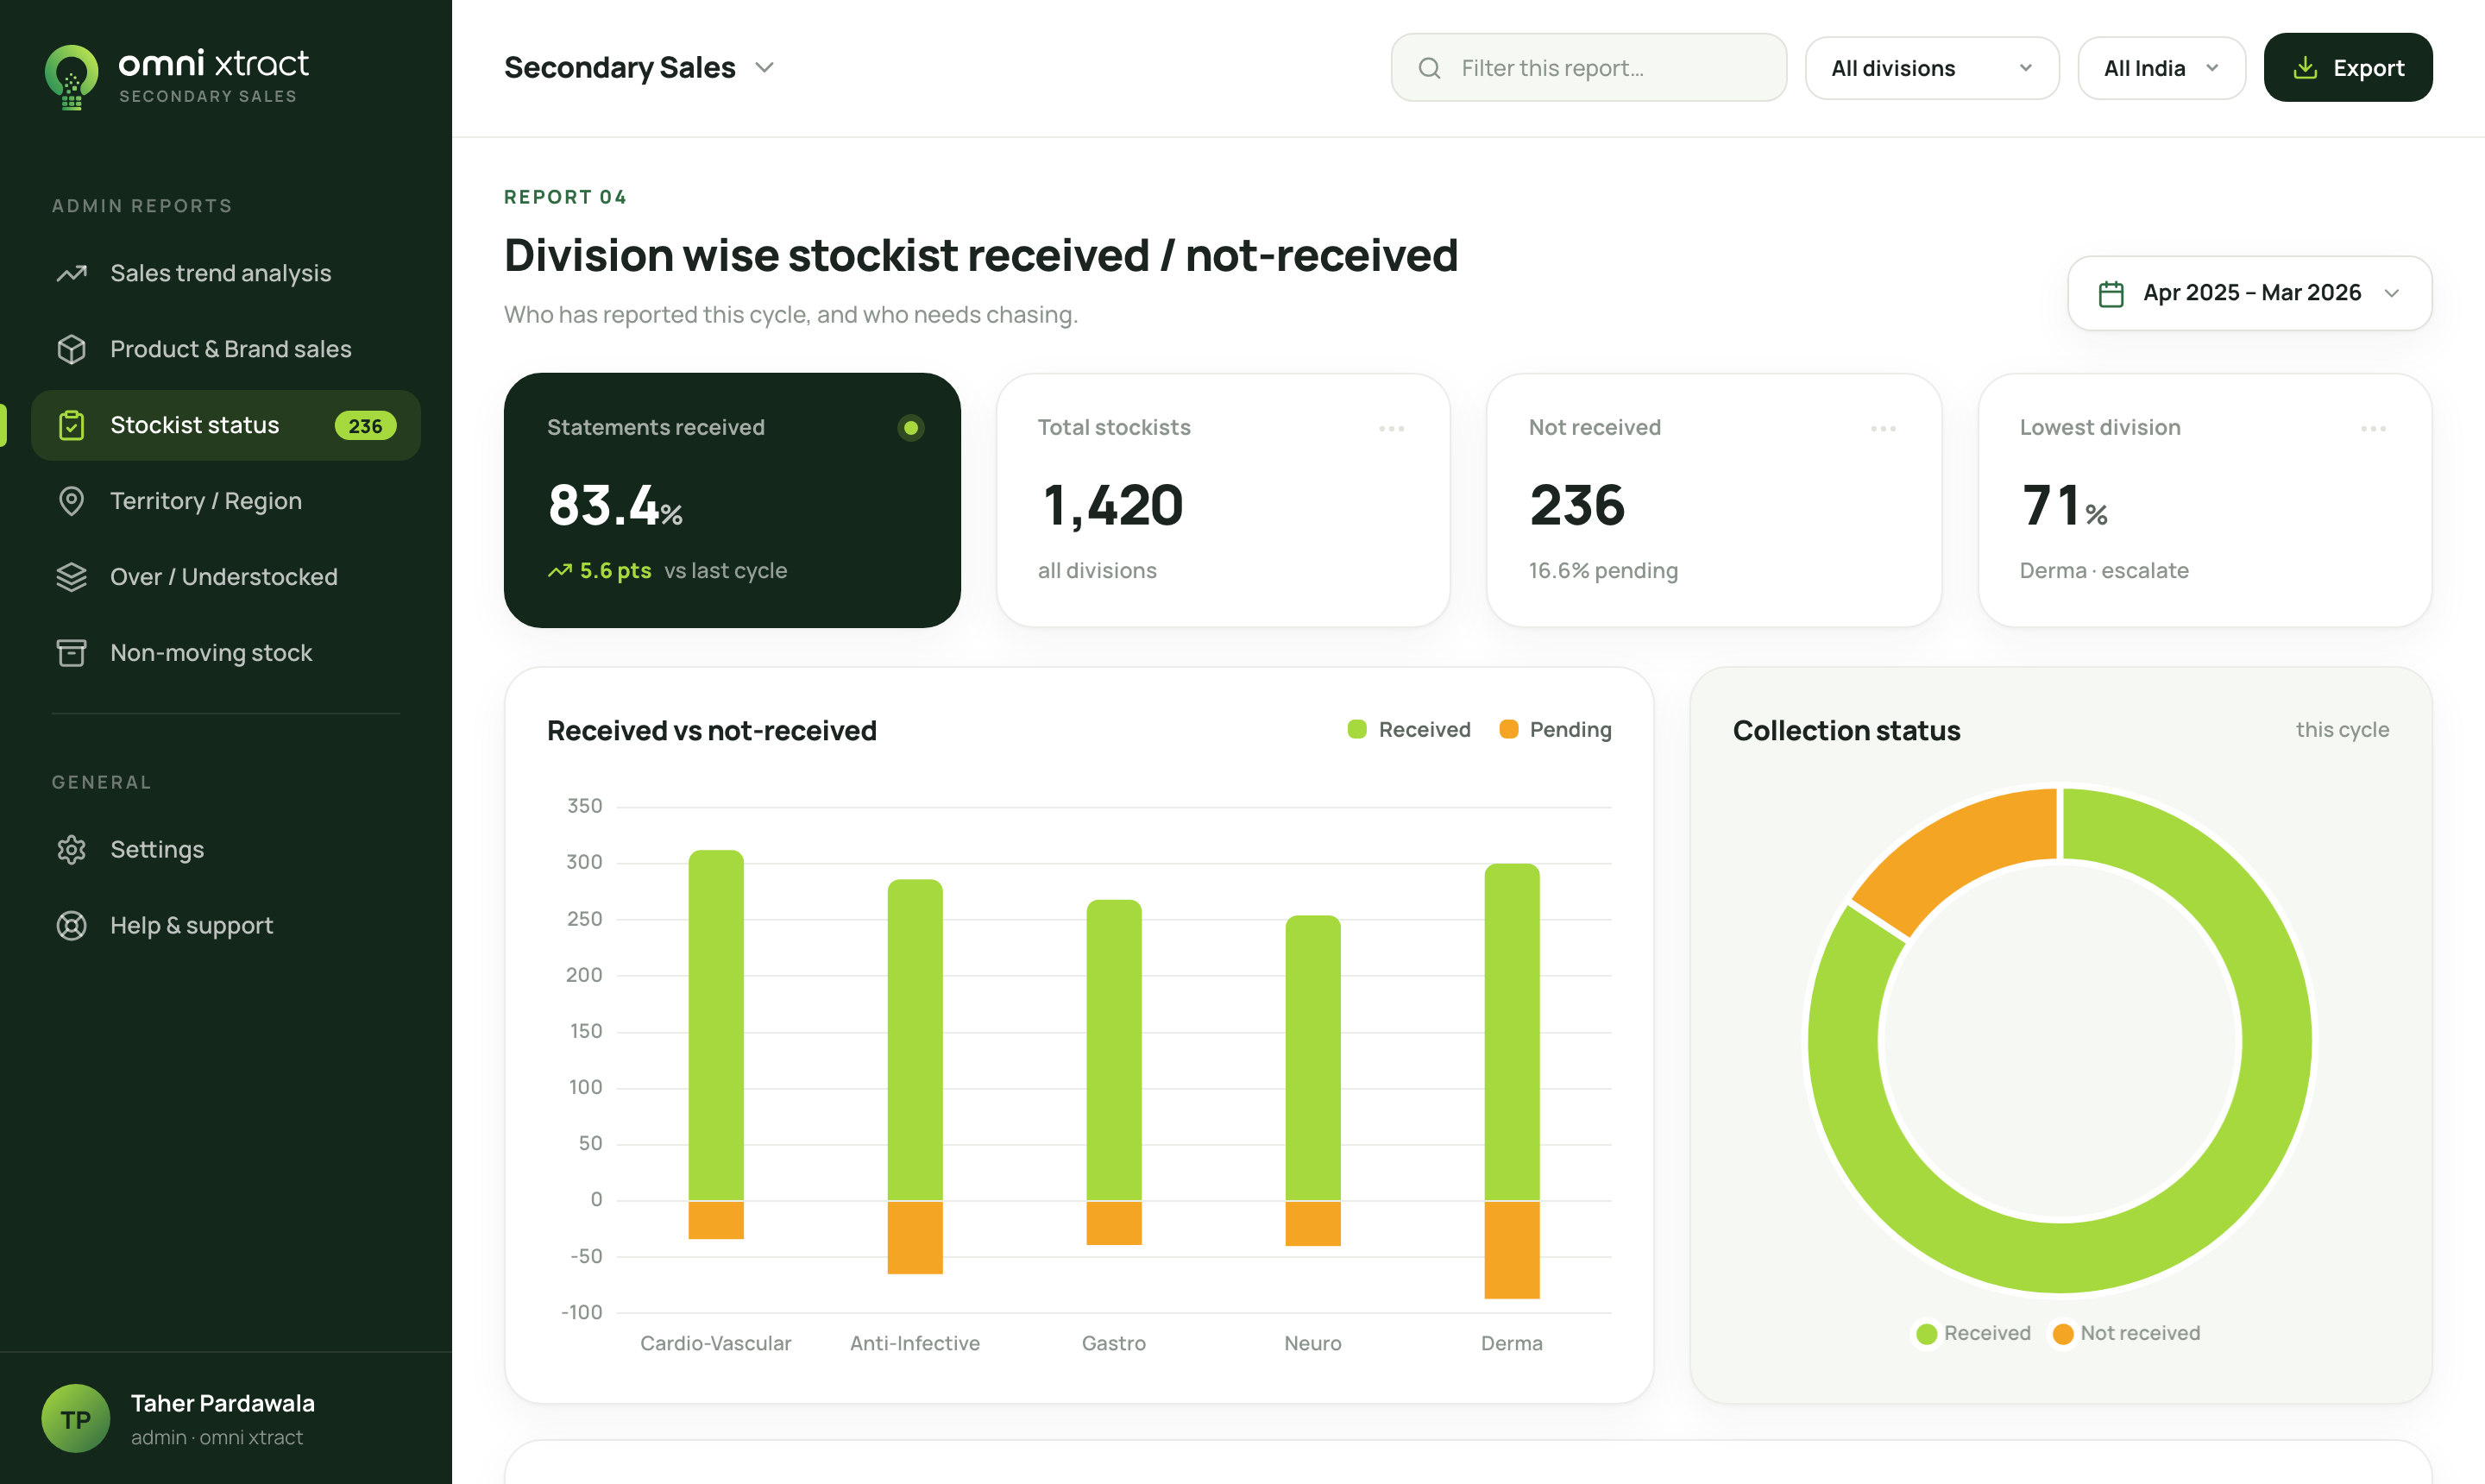
Stockist status
Which distributors have reported this cycle and which have not, by zone and region.
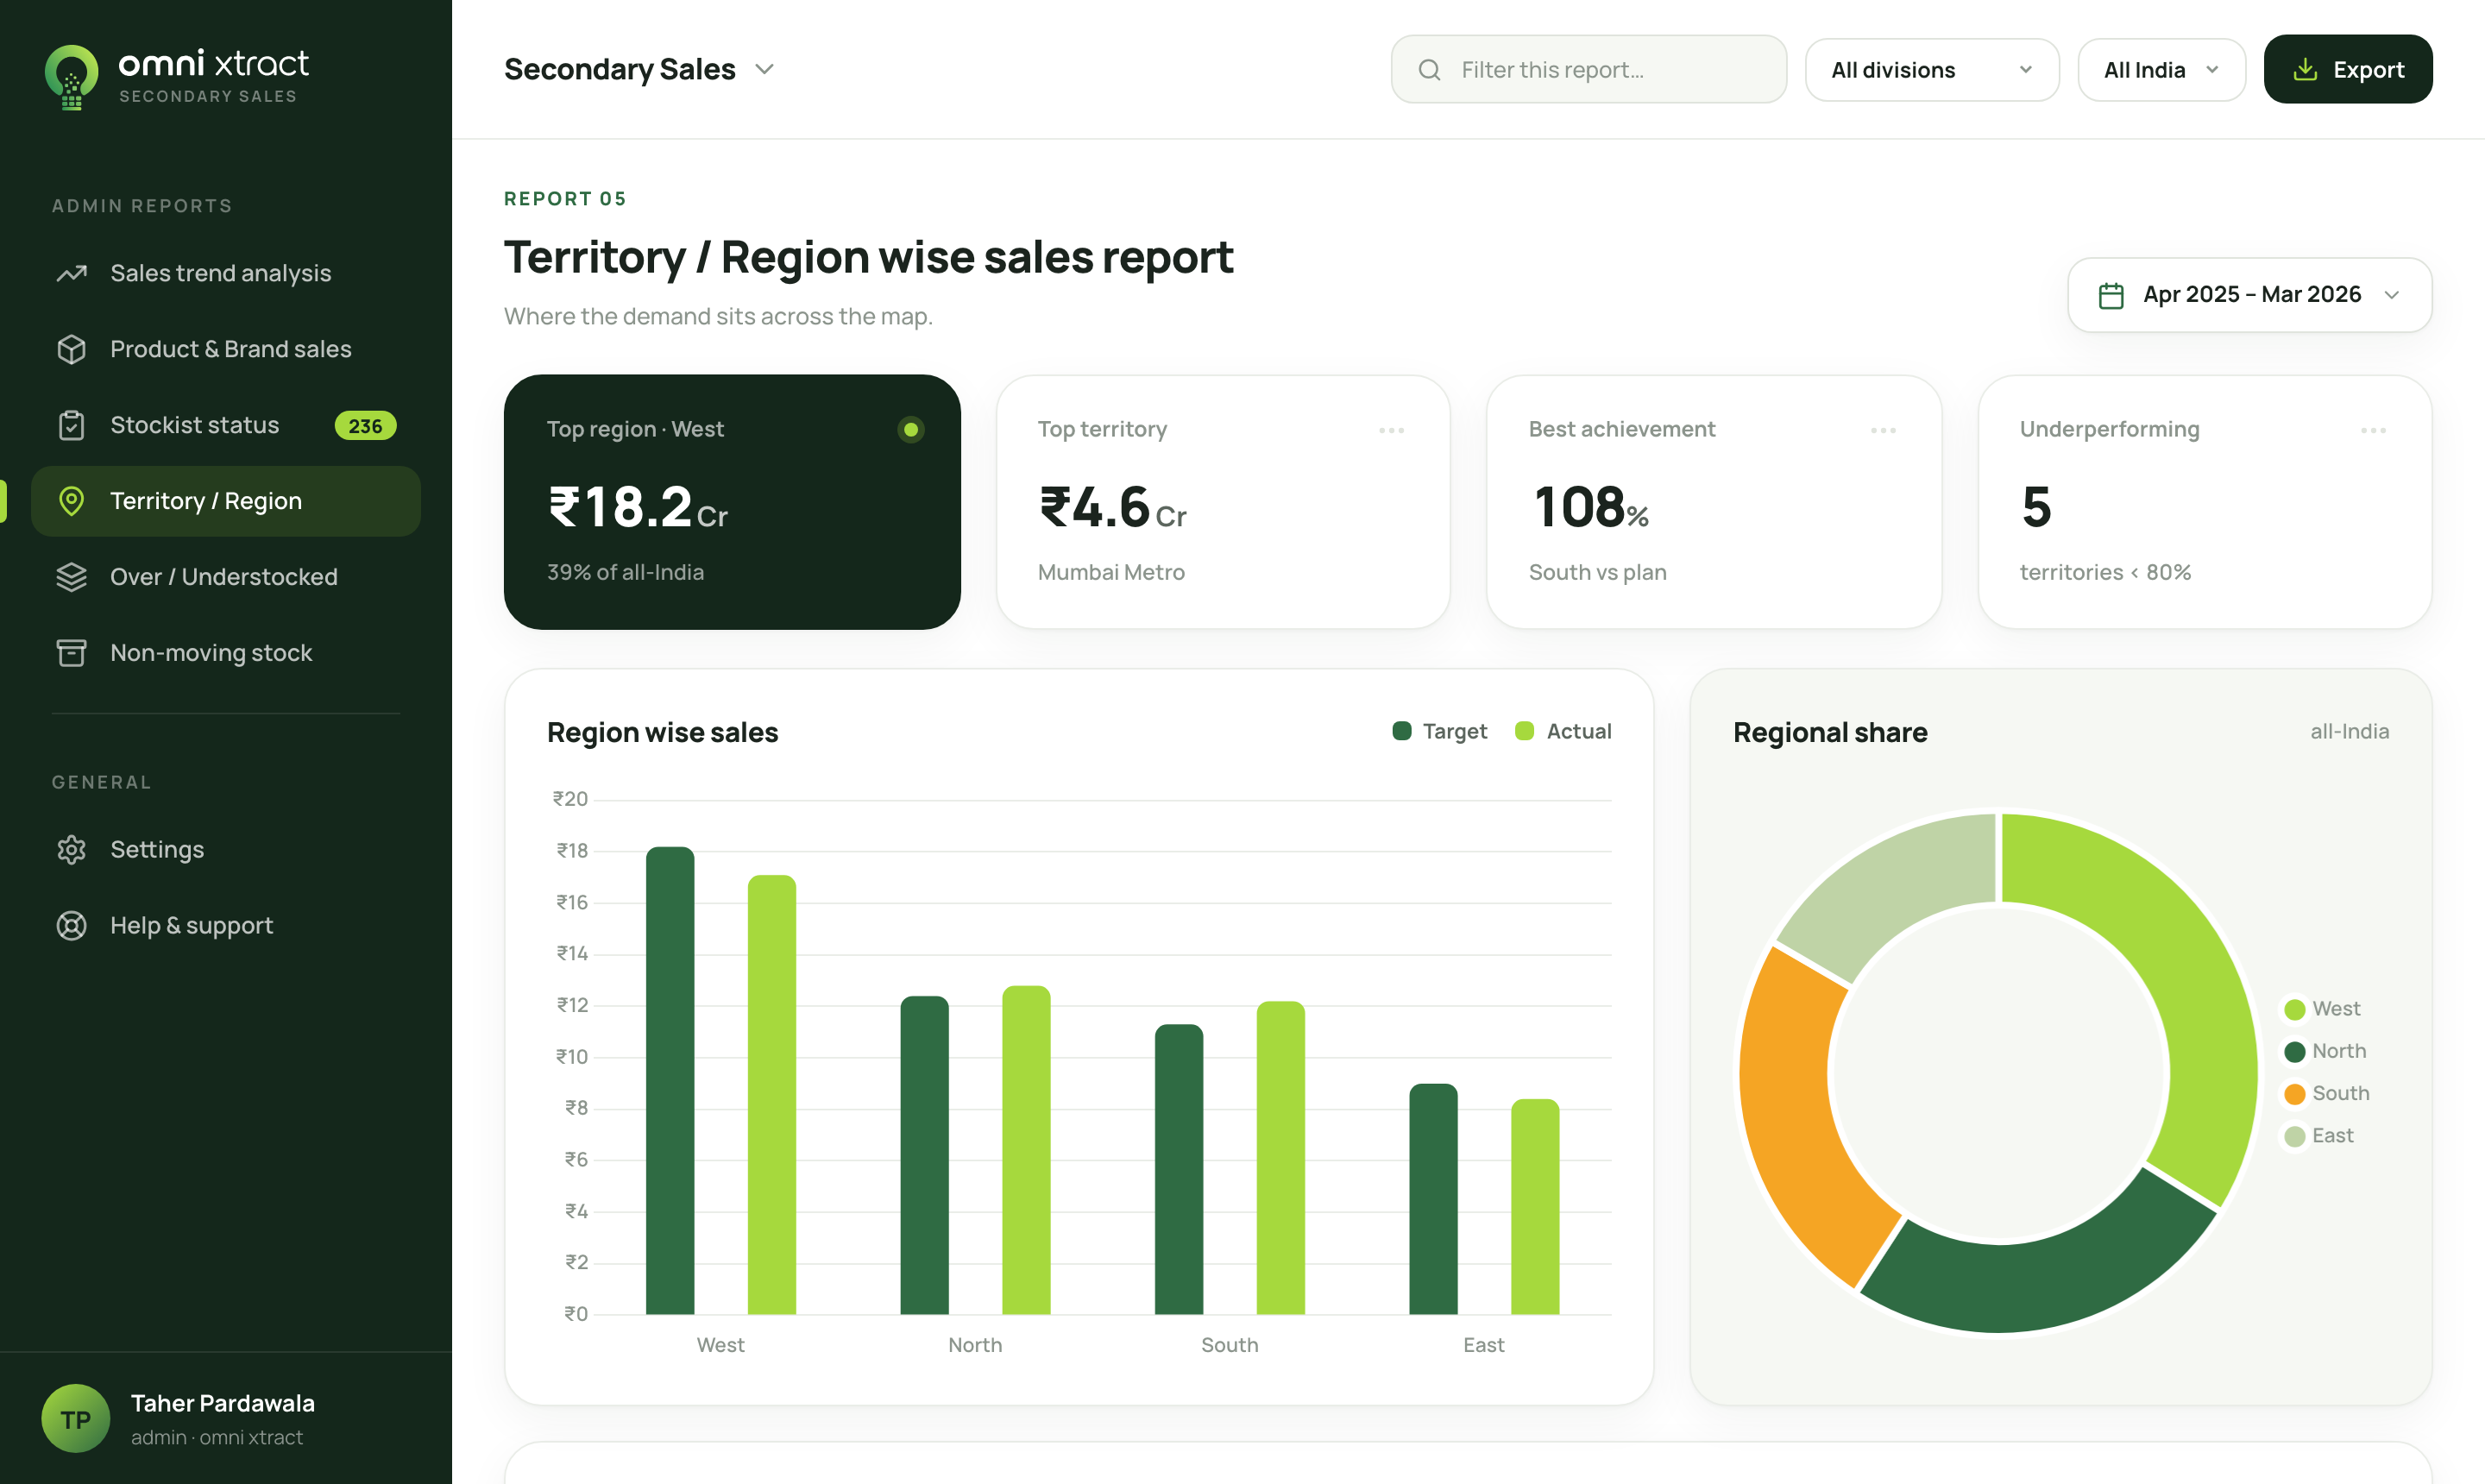
Territory and region
Secondary sales by geography, down to the territory a manager owns.
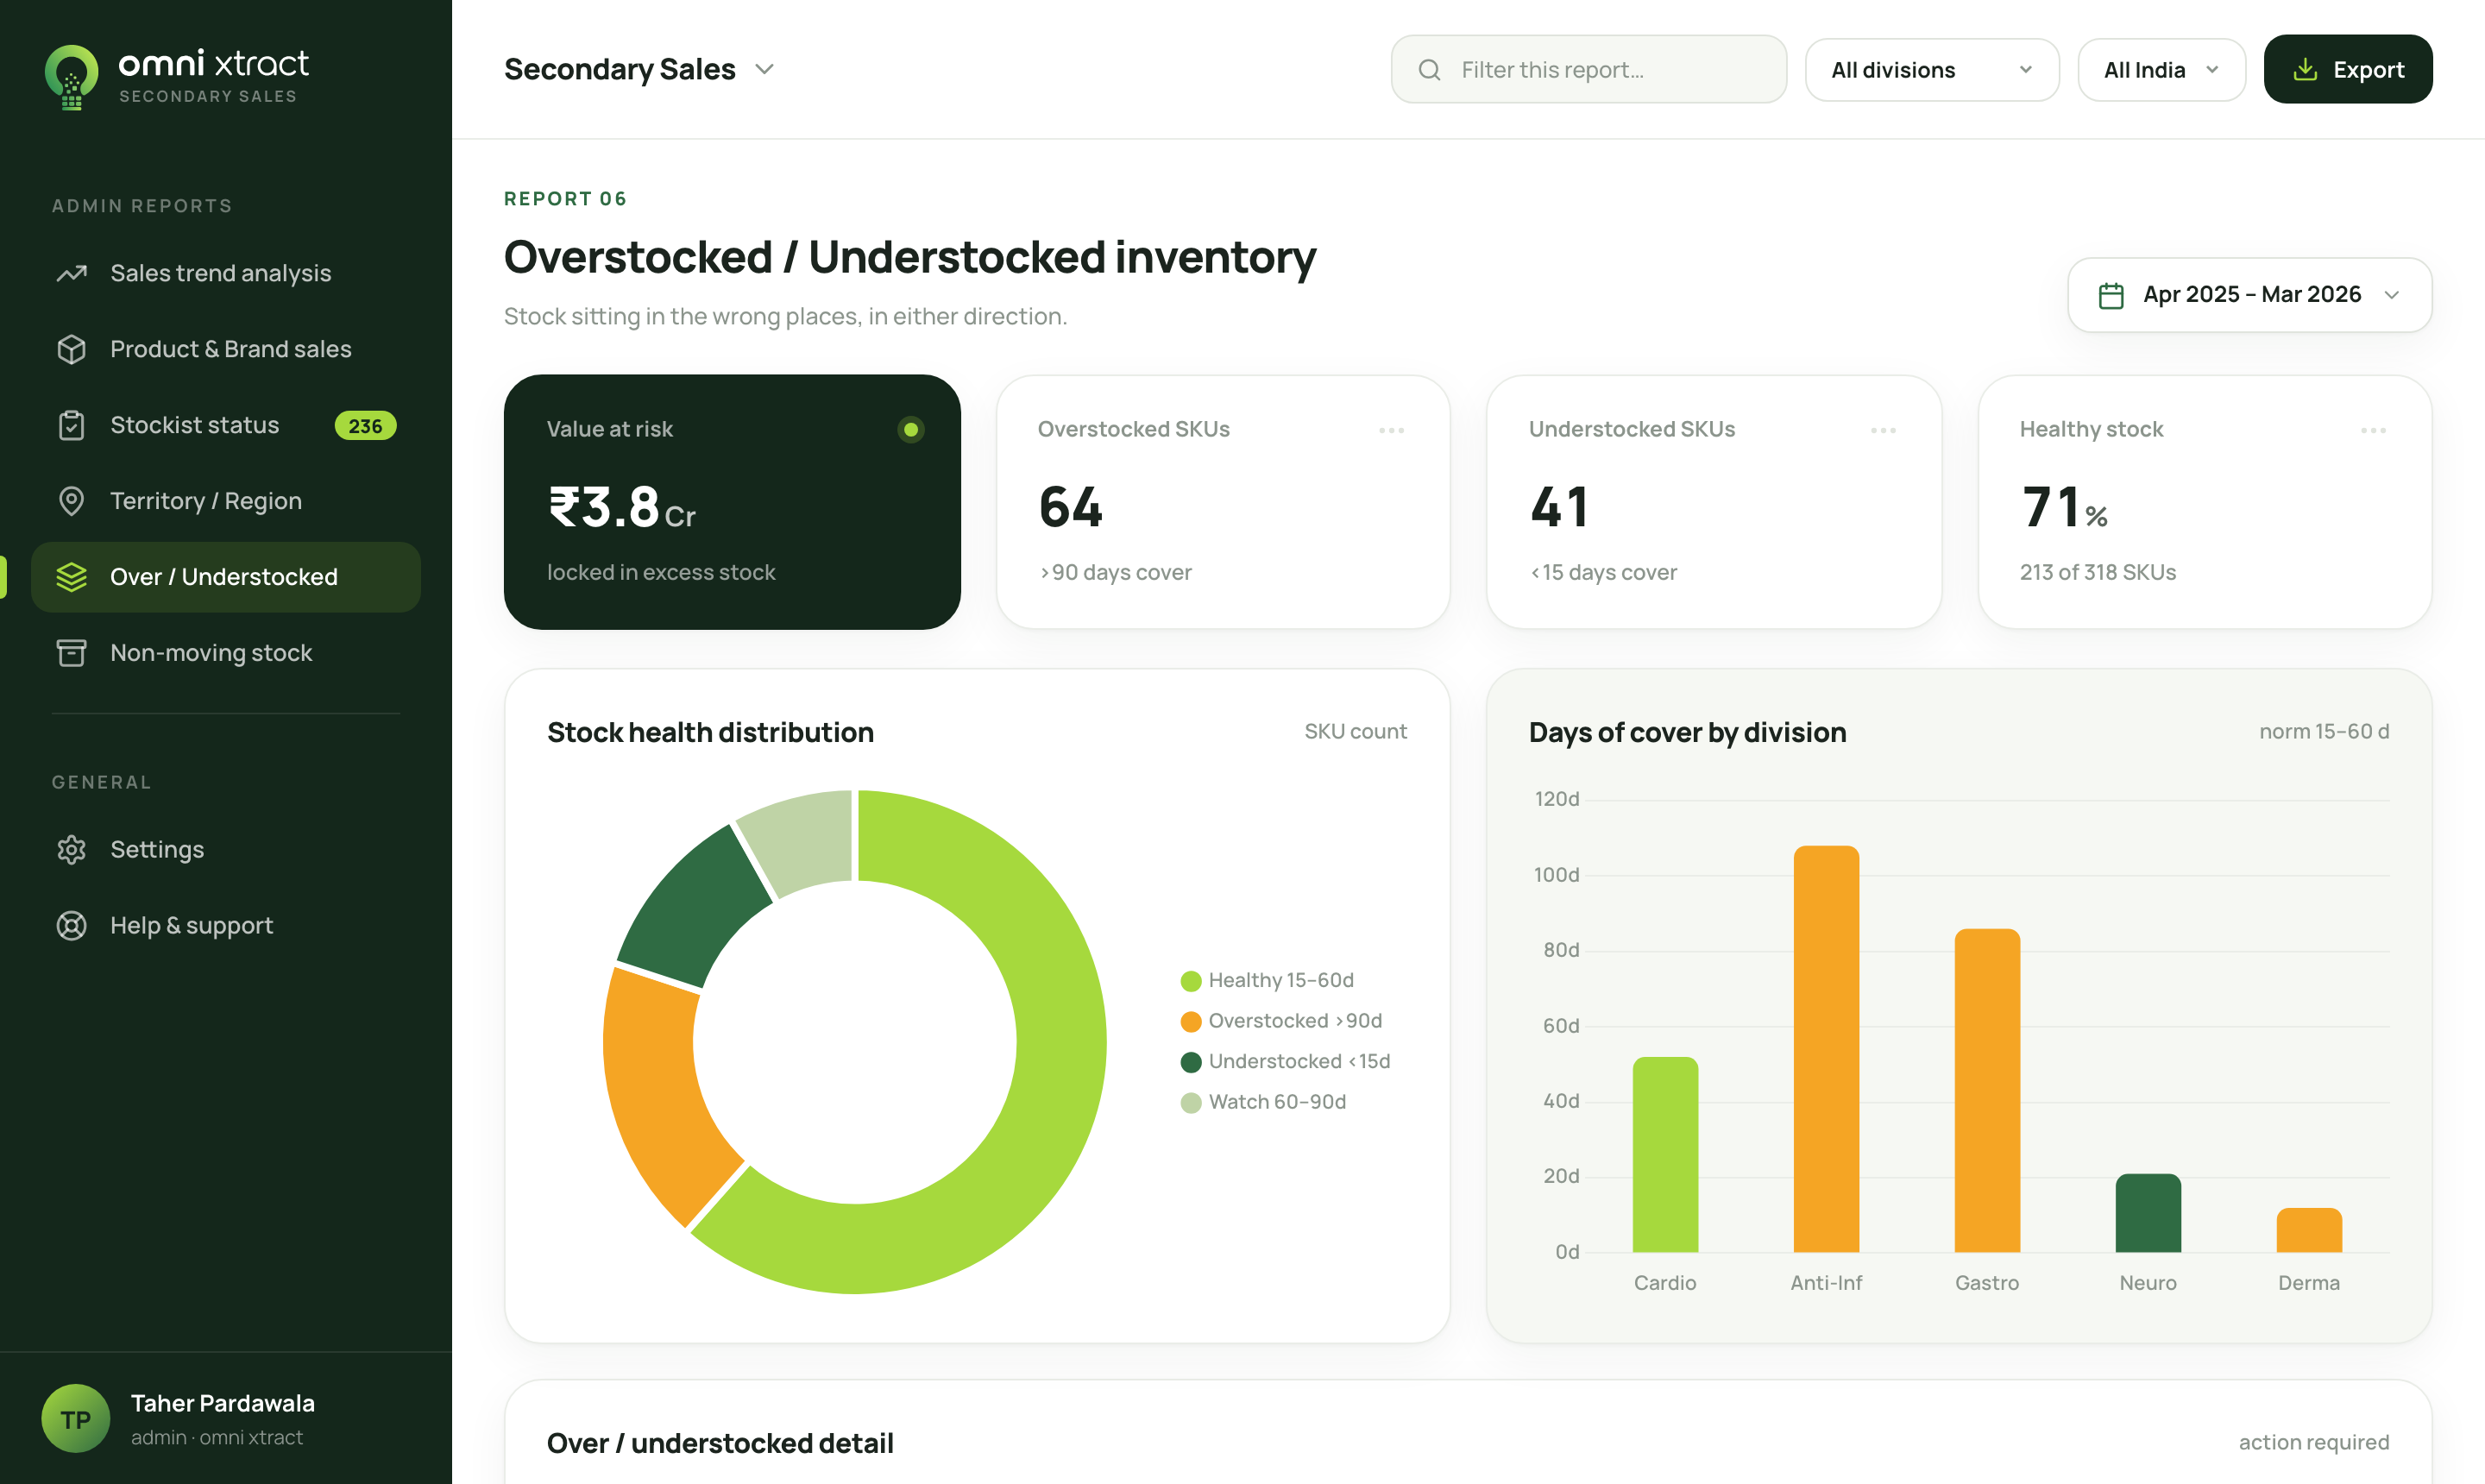
Over and understocked
Where stock is piling up and where high-demand territories are running thin.
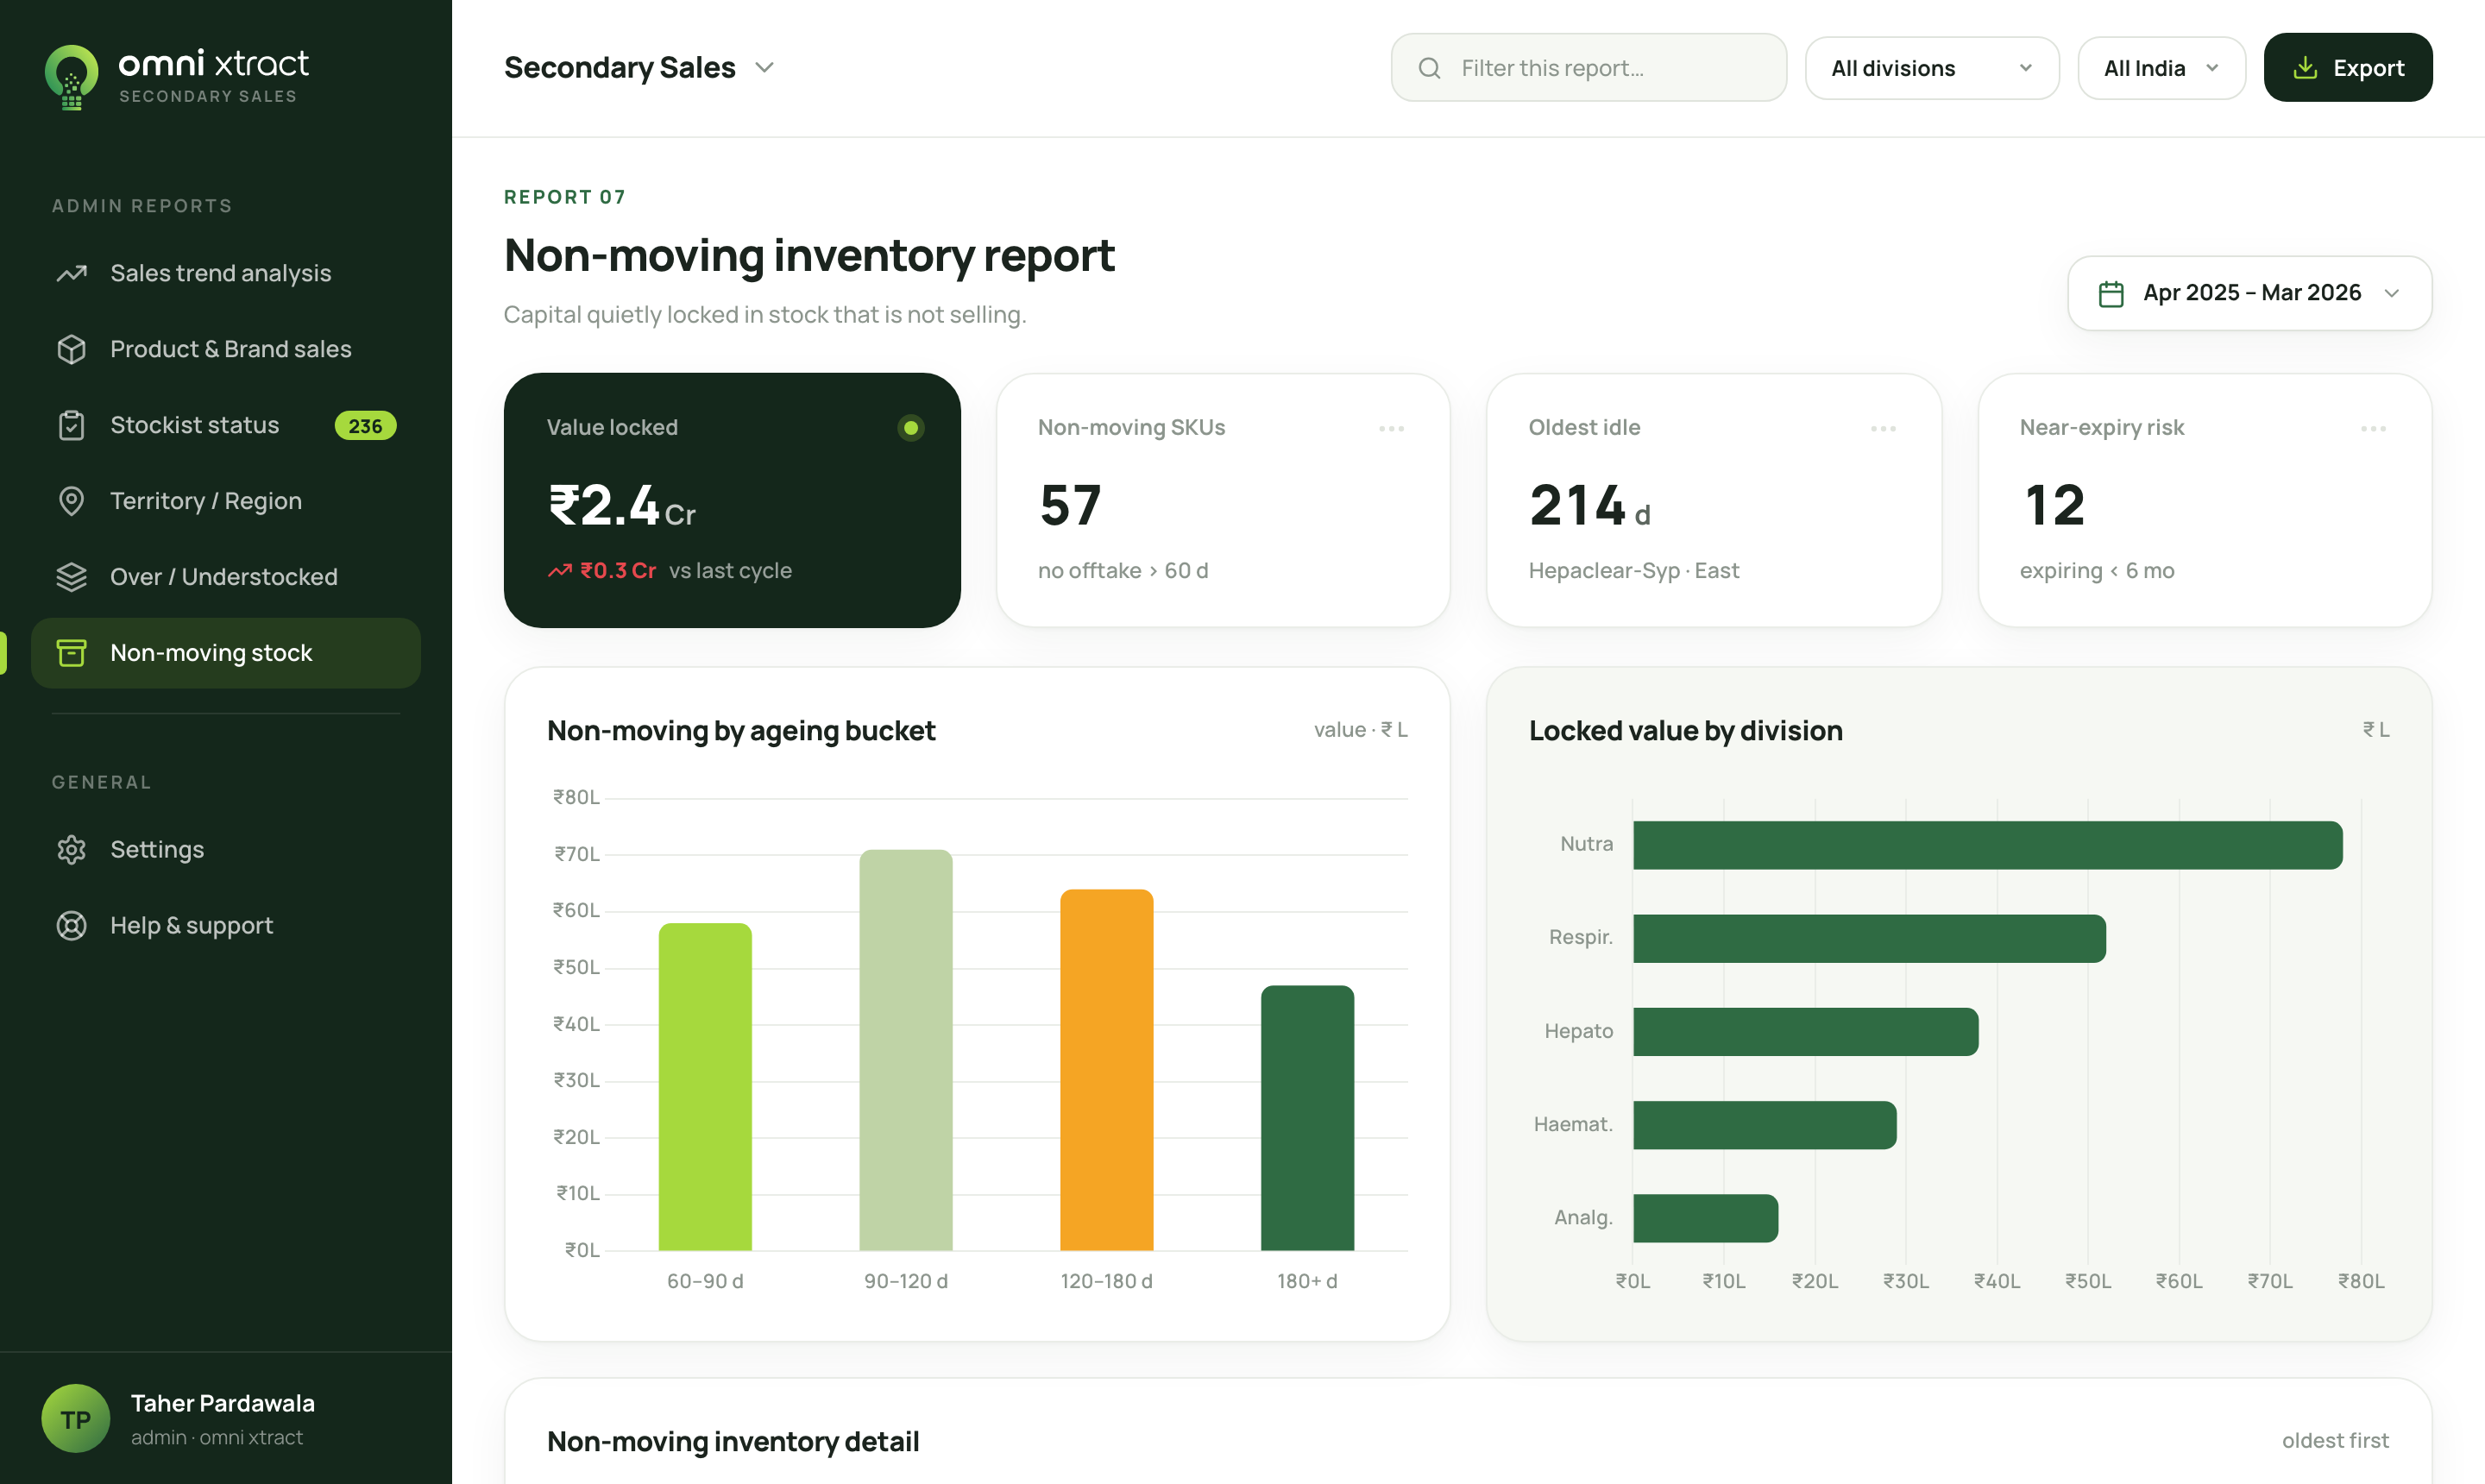
Non-moving stock
Ageing buckets for inventory that has stopped moving at the distributor.
Where this shape lives
Pharma is where it was proven, not where it stops.
Change the nouns and the diagram does not move. Any manufacturer selling through a multi-tier network goes blind after the first step, and Indian pharma is the hardest version of it we could find.
Pharmaceuticals
Proven here
ManufacturerStockistSub-stockistChemistFMCG
ManufacturerDistributorWholesalerRetailerAgrochemicals
ManufacturerDistributorDealerRetail counterWhite goods
ManufacturerDistributorDealerShowroom
Pharma is the deployment we run at scale. The others are domains with the same distribution structure and the same visibility gap, rather than deployments we are already running.
Operating reality
Why this succeeds where others fail.
Data source
- Manual and field reports
- Recorded by the field officer. Delayed, and shaped by targets.
- Traditional DMS
- The distributor has to adopt new software first.
- Omni Xtract
- Straight from the distributor statement. Field-independent.
Data quality
- Manual and field reports
- No QC, and an incentive to report strong numbers.
- Traditional DMS
- Only as good as the distributor's own data entry.
- Omni Xtract
- Multi-stage QC, with a validation formula on every file.
Distributor friction
- Manual and field reports
- A rep has to visit and key it in.
- Traditional DMS
- Install and maintain new software, forever.
- Omni Xtract
- None. Nothing on their side changes.
Scalability
- Manual and field reports
- Collapses at large distributor volumes.
- Traditional DMS
- Slow adoption, high change-management cost.
- Omni Xtract
- 100 to 5,000+ distributors, of any size.
Running for a growing list of pharma manufacturers, including Alkem, Sanofi, Indoco, Gufic and Medley, at least 30% cheaper than third-party data providers.
Questions
What teams ask before starting.
What do our distributors have to do differently?
Nothing. They keep sending the same statements, in the same format, through the same channel. There is no software for them to install and no training to run. That is deliberate: every system that asks the distributor to change something is a system that stops getting data.
Which file formats can you actually handle?
Tally, Marg, Busy, Excel, PDF, and statements that arrive over email or WhatsApp. Column layouts vary by distributor and billing software, so the extraction layer identifies the columns rather than expecting a fixed template.
How do you get to 99.5% accuracy on messy inputs?
The accuracy figure describes what the QC layer guarantees on the way out, not the quality of the source data. Every file is tested against the stock-flow formula, where opening plus received must equal sales plus closing. Records are compared against previous months for outliers, files with incorrect validity are rejected, and only verified records enter the main data set.
Does this depend on our field force cooperating?
No, and that is the point. The data comes from the distributor statement rather than from a rep's report, so no one in the field can delay, omit or reshape what reaches head office. Field officers still get alerts, but they are not the source of truth.
How does product mapping keep up with new launches?
Product names vary by region, billing software and format, so a model maps statement entries to your company codes. Around 95% map automatically. The remainder is flagged for review, and that share drops after the first few months because the model retrains on new launches and fresh sales data.
Is this only for pharma?
Pharma is where it was built and proven, because Indian pharma distribution is about as hard as this problem gets. The pipeline is built for any multi-tier distribution network, which is why FMCG, agrochemicals and white goods are where we are taking it next. Those are domains with the same problem shape rather than deployments we are already running.
Product teams and technology leaders who ship with us.















Talk to us
Bring us a month of statements.
The fastest way to see whether this works on your network is to run it on your actual data. Send a cycle of distributor statements and we will show you what comes out the other side.
Senior engineers reply within one business day.