Secondary Sales Automation: The Complete Guide for a Distributed Field Force (FMCG & Pharma)
By Huzefa Motiwala · Co-Founder & Chief Product Officer

TL;DR
- Secondary sales automation captures sell-out (distributor to retailer), the only number that tracks real demand; your ERP only ever sees sell-in.
- The stack has three layers: ERP for primary billing, DMS for distributor operations, SFA for field execution. Most projects fail in the wiring between them, not inside any one tool.
- Roughly 60% of SFA rollouts fail on field adoption, and maintenance eats 50-80% of a custom build’s cost of ownership, so buy the apps and build only the glue.
- File-format normalization is the hard engineering: distributor exports drift constantly, and document AI can drop to 40% accuracy on invoice line items.
- Reconcile with the stock identity (opening + purchases - sales - returns = closing); a sell-in gap that outruns sell-out by 20-30% for months signals channel stuffing, not growth.
Secondary sales automation is the system that captures what your distributors sell onward to retailers, cleans that data, and reconciles it into numbers you can actually run the business on. It spans an SFA app in the rep’s pocket, a DMS at the distributor, and the pipeline that turns dozens of messy export formats into one validated stream. This guide maps the whole stack: what each layer does, how the pipeline works, whether to build or buy, how to win field adoption, and how reconciliation catches the lies. We’ve rebuilt these systems in client work; this is the map we wish we’d had on day one.
What is secondary sales automation?
Secondary sales are what a distributor sells to retailers or pharmacies, recorded in the distributor’s systems, not yours. Automating them means capturing those transactions continuously, normalizing them into one schema, and reconciling them against stock, so demand planning runs on what the market bought rather than what you shipped.
The distinction that drives everything else in this guide is primary vs secondary sales data:
- Primary (sell-in): you invoice the distributor from your own ERP. Clean, immediate, and shaped by your targets and schemes.
- Secondary (sell-out): the distributor sells to the retailer. This is real demand, and it lives in someone else’s software.
- Tertiary (offtake): the retailer sells to a consumer. Mostly invisible outside modern trade.
Running a channel on sell-in alone amplifies noise. The bullwhip effect is the classic result: small shifts at the shelf swell as each tier pads its orders, and a 10% demand change can become a 40-50% swing upstream. Secondary data is the only brake on that loop.
Why is sell-out data so hard to capture?
Because the last mile of distribution data sits in fragmented systems owned by people whose incentives lean against sharing it. The distributor’s billing software knows the truth; getting it out reliably, at line-item level, every day, is where pipelines break first.
Three forces make this structurally hard:
- Fragmentation. In Indian FMCG, general trade drives roughly 70-75% of sales across an estimated 13 million kirana stores, served by thousands of distributors on Tally, Busy, Marg, or plain Excel.
- Incentives. Distributors know granular sell-out data exposes them to disintermediation, so channel partners resist sharing it. A pipeline design that ignores this gets quietly starved of files.
- Drift. Even a cooperative distributor’s export changes shape over time: renamed columns, new tax fields, a clerk’s creative date formats. One-off parsers rot within a quarter.
The general-trade reality check
Kirana-dominated general trade adds its own physics. A meaningful share of volume moves as van sales settled in cash on the route, beats visit an outlet weekly at best, and the smallest distributors bill from handwritten books that only reach software at day’s end. Any automation plan that assumes clean daily digital capture from every node will report precision it doesn’t have; the honest design captures what each tier can give and reconciles the rest.
None of these are model problems or app problems. They are trust and plumbing problems, which is why the rest of this guide spends so much time on the pipeline and the people, not the software demo.
What are the layers of the stack: ERP vs DMS vs SFA?
Three systems get conflated in every first meeting. The ERP bills your primary sales. The DMS runs the distributor’s operation: inventory, billing to retailers, claims, and it is where secondary sales are recorded. The SFA runs your field force: beats, outlet visits, order capture. You need all three doing their own job, wired together.
| Layer | Who runs it | What it owns | The question it answers |
|---|---|---|---|
| ERP | Your company | Primary billing, finance, inventory at your depots | What did we ship and invoice? |
| DMS | Distributor (deployed by you) | Distributor stock, retailer billing, schemes, claims | What did the channel actually sell? |
| SFA | Your field force | Beat plans, outlet visits, order booking, merchandising | What happened at the shelf today? |
The failure pattern we see most is buying one layer and expecting it to do another’s job: an SFA rollout that never sees distributor billing, or a DMS nobody at the distributor opens. The layers are also the seams where the build vs buy question gets decided, section by section, not for the stack as a whole.
This short explainer walks the same three data sources and where each one’s numbers come from:
How does the secondary sales data pipeline actually work?
Every working pipeline we’ve built or rescued has the same four stages: ingest, normalize, validate, serve. The stages are simple to name and unforgiving to run, because the input is dozens of file formats that drift over time.
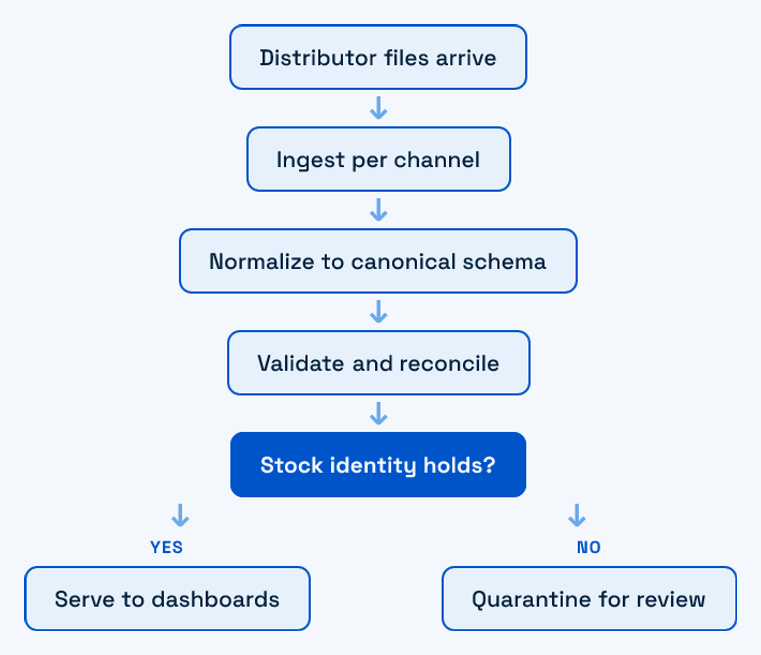
Ingest: meet the data where it lives
Distributor data arrives as Tally and ERP exports, Excel workbooks, CSV dumps, scanned PDF invoices, and pasted email tables. The channel mix matters more than the parser: DMS API where you’re lucky, SFTP drops, WhatsApp attachments where you’re not. We covered the full format taxonomy in the distributor data problem.
Tally deserves its own line because it is the billing system we meet most often across Indian distribution, with Busy and Marg close behind. In practice you get sell-out from it three ways, in ascending order of reliability: a clerk manually exporting sales registers to Excel on a schedule, a scheduled export job producing XML or CSV drops, or a connector that pulls from Tally programmatically. Manual exports are where drift breeds; if a distributor matters, invest in moving them up that ladder before investing in smarter parsing.
Normalize: one canonical schema, enforced by contract tests
Define the canonical invoice-line record once (distributor, outlet, SKU, batch, quantity, value, date), then write per-source adapters that map into it. Contract tests per distributor catch drift the day it happens instead of the month-end it corrupts. Excel does its own quiet damage on the way in; treat every workbook as hostile input.
Validate: quarantine, don’t average
Records that fail checks (unknown SKU, negative stock, impossible dates) go to a quarantine queue for a human, never silently dropped or padded. Scanned invoices deserve extra suspicion: in a public benchmark, tools scoring in the 80s and 90s on header fields dropped as low as 40% accuracy on line items, and line items are where the revenue signal lives. The same extraction-layer lesson shows up across enterprise document AI generally.
Scanned PDFs: budget for the human in the loop
Some tail of distributors will only ever send photographed or scanned invoices, and that tail is exactly where OCR confidence should gate the flow: high-confidence lines pass, low-confidence lines route to a correction queue with the source image beside the extracted fields. Whether a classic OCR stack or an LLM-based extractor sits underneath changes cost and failure shape more than accuracy; we compared the two in LLM document processing vs traditional OCR. The design constant is that a corrected line teaches the pipeline only if corrections feed back into templates and tests.
Serve: dashboards are the easy part
Once the stream is trustworthy, forecasting, scheme payouts, and replenishment all read from it. If your dashboards disagree with the distributor’s ledger, nobody uses the dashboards, which is why validation comes before visualization in every design review we run.
Should you build or buy secondary sales automation?
For most distributed field forces: buy the SFA and DMS layer, and build only the ingestion-and-reconciliation glue that connects them to your systems. A packaged platform gets reps live this quarter; a full custom build rarely repays its maintenance bill.
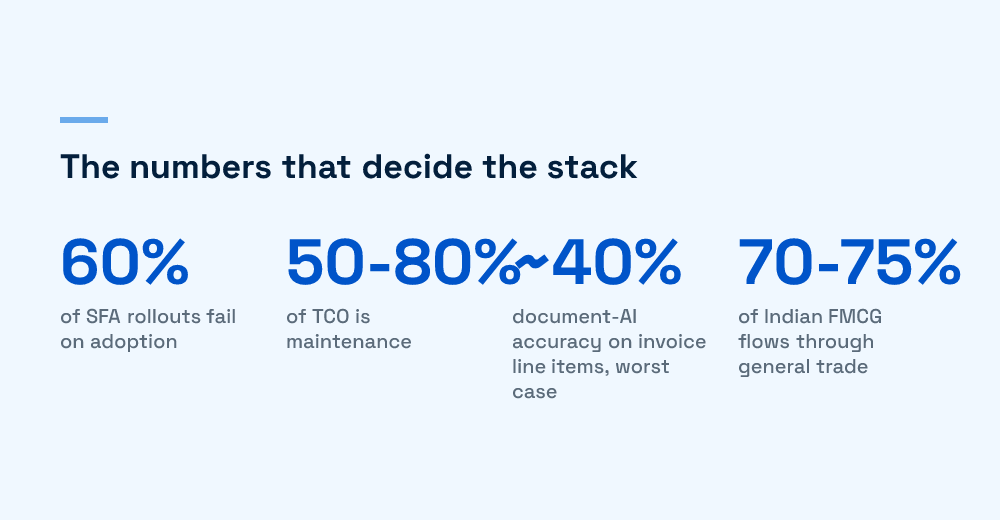
Two numbers anchor the decision:
- Roughly 60% of SFA rollouts fail on adoption, not on broken code. Vendors have already burned through the field-usability lessons you’d relearn at your reps’ expense.
- Software maintenance consumes 50-80% of total cost of ownership. A custom SFA is a decade-long payroll commitment dressed up as a one-time project.
What stays custom is the glue: your canonical schema, your adapters, your reconciliation rules, your integration into ERP and BI. That layer is small, high-leverage, and genuinely yours. The full six-dimension scoring framework, including the failure modes of each path, is in our build vs buy deep dive.
How do you shortlist SFA and DMS platforms?
Shortlist on fit to your channel, not on feature-count. The India-focused platforms (Bizom, FieldAssist, BeatRoute among the established names) overlap heavily on paper; the differences that survive contact with your field force are structural, and a two-week pilot exposes them.
- Channel-mix fit: a general-trade-heavy beat structure stresses offline capture and van-sales flows; modern trade stresses promotions and planogram audits. Ask which the vendor’s roadmap actually serves.
- Offline behaviour under real network conditions: demo it on a 2G route, not office Wi-Fi. Watch what happens to a half-synced visit.
- DMS pairing: SFA and DMS deliver value as a pair; a vendor whose DMS your distributors refuse to adopt leaves you buying integration work either way.
- API access for the glue: if line-level data can only leave the platform as a scheduled report email, your reconciliation layer inherits a daily parsing job. Contract for APIs up front.
We’re publishing a head-to-head comparison of the major platforms as a companion piece to this guide; the shortlist criteria above are the skeleton it hangs on.
How do you get the field force to actually use it?
Treat adoption as the product. The rep experience decides whether your data exists at all: every skipped visit log is a hole in the sell-out stream that no pipeline downstream can repair.
The design constraints that matter in practice:
- Offline-first, always. Tier 2/3 routes have dead zones; capture must work without signal and sync later without duplicating. The sync architecture is the same one we documented for offline field apps in construction.
- The visit flow must beat the notebook. If logging an outlet takes longer than the paper it replaced, reps will do it from the parking lot at day’s end, and the geo-stamps will say so.
- Plan for churn. FMCG field-sales attrition in India runs 25-35% a year, so onboarding is a permanent operation, not a launch task. A tool that needs a training day loses up to a third of its trained users annually.
- Give reps something back. An app that only extracts reporting reads as surveillance. Outlet history, pending claims, and suggested orders make the same app worth opening.
How do you reconcile distributor stock so the numbers hold?
One identity governs the whole channel: opening stock + purchases - sales - returns = closing stock, per SKU, per distributor, per period. Automation makes the identity checkable at scale; when it doesn’t hold, something upstream is wrong, and the gap tells you where to look.
The reconciliation failures worth designing for:
- Returns handling. Returns lag sales by weeks and arrive with disputed values. Book them when confirmed, tagged to the original period, or your trend lines whipsaw.
- Channel stuffing. In our client work, cumulative sell-in outrunning sell-out by 20-30% for several periods means inventory is piling up and demand is inflated. The pattern has teeth: the SEC’s case against Bristol-Myers Squibb over channel stuffing ended in a $150 million settlement.
- Audit trail. Every reconciled number should trace to source files and transformations. The lineage is what lets the number survive a finance review, and it is cheap to add early and brutal to retrofit.
The working math, the edge cases, and why the identity breaks in the field are laid out in our primary vs secondary sales piece.
What changes in pharma?
Pharma runs the same pipeline through more tiers and tighter rules. Stock moves through CFA or C&F agents before stockists, every unit carries a batch and expiry, and returns split into saleable and non-saleable with different financial treatment. Each tier adds a reconciliation boundary where quantities can silently diverge.
The compliance layer raises the stakes: expiry-driven returns, GST credit notes against disputed claims, and batch-level traceability mean a pharma pipeline that merely counts boxes will fail its first audit. We walk the full architecture, tier by tier, in how the pharma secondary sales pipeline works and breaks.
How do you roll it out without stalling?
Sequence beats scope. Every stalled rollout we’ve been called into tried to launch everything, everywhere, at once. The pattern that works starts embarrassingly small and scales on evidence:
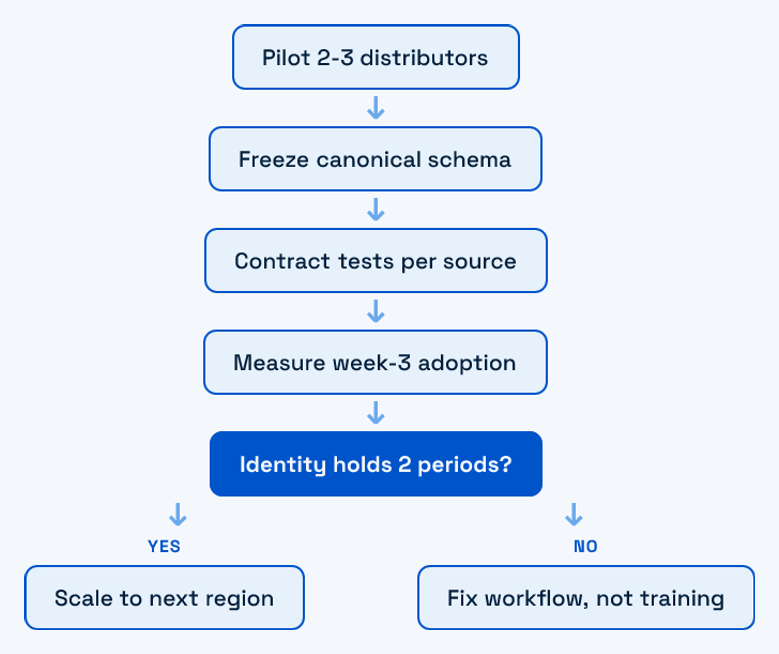
- Pilot with 2-3 friendly distributors spanning your messiest and cleanest data sources, so the pipeline meets reality early.
- Define the canonical schema before any integration. Adapters change; the schema is the contract that shouldn’t.
- Wire contract tests per source from day one. Format drift detected at ingest costs minutes; detected at month-end it costs the quarter’s trust.
- Measure week-3 adoption per beat, not launch-day logins. Week three is where the 60% failure statistic is decided.
- Scale by region only after the identity holds for two consecutive periods in the pilot. A reconciliation gap you can’t explain at 3 distributors becomes unexplainable at 300.
Interfaces matter here more than teams expect: reconciliation reviews live or die on how legibly you present exceptions, a problem we’ve treated at length in designing UIs for heavy data workflows.
Which KPIs prove the system is working?
Measure the pipeline’s health and the channel’s health separately. A dashboard that mixes the two hides whether a bad number means weak sales or broken plumbing.
- Pipeline health: percentage of distributors reporting within SLA, records quarantined per source, days since last successful file per distributor, and reconciliation gap per SKU. These four catch rot before it reaches a forecast.
- Field execution: productive call rate (visits that produced an order), lines per call, and beat coverage. Lines per call is the quiet one; it falls weeks before revenue does.
- Channel health: sell-in to sell-out ratio trending near 1.0, stock cover in days at each distributor, and fill rate to retailers. A widening ratio is the channel-stuffing alarm from the reconciliation section.
- Scheme integrity: claims settled against verified sell-out vs claims paid on trust. The spread between those two is usually the fastest payback line in the business case.
Review the pipeline metrics weekly with engineering and the channel metrics monthly with sales leadership. The split keeps each meeting actionable and stops data-quality debates from hijacking demand reviews.
What does good look like?
A working secondary sales system is boring in the best way. Files arrive, adapters absorb the drift, exceptions queue for a human, and by mid-morning both you and the distributor are looking at the same number without arguing about it. Forecasts run on sell-out. Schemes pay against verified volumes. The bullwhip quiets down.
Getting there is not a software purchase; it’s a system you assemble deliberately: bought apps at the edges, owned glue in the middle, reconciliation as the referee. Start with the pilot, respect the rep’s thumb, and treat every distributor file as a renewable source of surprises. That posture, more than any tool choice, is what separates the pipelines that survive from the dashboards nobody opens.
Frequently Asked Questions
What is the difference between primary, secondary, and tertiary sales?
Primary sales are your invoices to distributors (sell-in), recorded in your own ERP. Secondary sales are the distributor’s sales to retailers or pharmacies (sell-out), recorded in the distributor’s systems. Tertiary sales are retailer-to-consumer offtake, which is mostly visible only in modern trade with POS integration. Demand planning should key off secondary data because sell-in reflects your targets and schemes, not what the market actually bought.
Can you track secondary sales without a DMS?
Yes, and most companies start that way: distributors email Tally or Excel exports, and a pipeline normalizes them into a canonical schema. It works if you enforce contract tests per distributor and quarantine bad records. What you lose without a DMS is real-time visibility and scheme automation at the distributor end, so most teams treat file-based ingestion as the on-ramp and move heavy distributors onto a DMS over time.
How long does a secondary sales automation rollout take?
A disciplined pilot (2-3 distributors, canonical schema, contract tests, one region’s reps) typically proves itself in one quarter. Scaling nationally is then a distributor-onboarding treadmill rather than an engineering project: each new source needs an adapter, a test suite, and a few weeks of parallel-run reconciliation. Plans that promise full coverage in a single quarter usually mean dashboards shipped before the data underneath them is trustworthy.
What data should a distributor share, at minimum?
Invoice-line level sell-out: date, outlet, SKU, batch (pharma), quantity, value, plus periodic closing stock per SKU. Aggregated monthly summaries can’t support the stock identity (opening + purchases - sales - returns = closing), so reconciliation degrades into guesswork. If a distributor resists line-level sharing, offering something back, such as automated claim settlement against verified volumes, changes the conversation faster than contract clauses do.