
Pharma Secondary-Sales Data Extraction: How the Pipeline Works and Where It Breaks
Taher Pardawala July 1, 2026
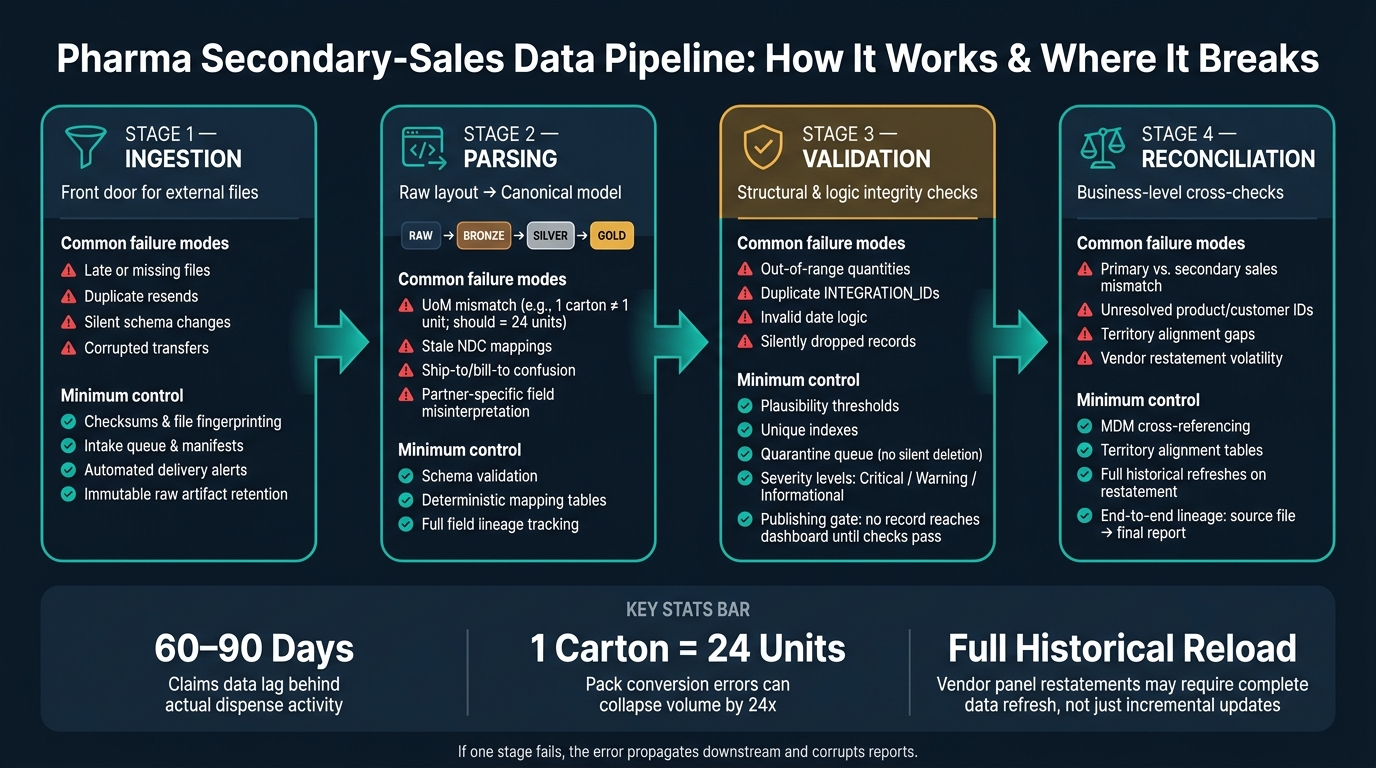
If your secondary-sales pipeline fails at any step, your reports can be wrong by a lot. In pharma, that usually starts with four problem areas: bad file intake, wrong field mapping, weak rule checks, and failed business tie-outs.
Here’s the short version in plain English:
- Ingestion fails when files are late, missing, resent, or changed without notice.
- Parsing fails when source fields map the wrong way, units are converted wrong, or product/customer IDs do not match.
- Validation fails when duplicates, date errors, bad quantities, or missing required fields slip through.
- Reconciliation fails when secondary sales do not line up with shipments, claims, or territory mappings.
A few facts stand out:
- Claims data can lag actual dispense activity by 60 to 90 days.
- A single pack conversion error can turn 1 carton into 1 unit instead of 24 units.
- Vendor panel restatements can force full historical reloads, not just incremental updates.
My takeaway: a reliable pipeline keeps the raw file unchanged, logs every load, maps source data into one internal model, quarantines bad records, and tracks lineage from source file to final report.
This article breaks that flow down step by step, so you can see how the pipeline works, where it usually breaks, and what controls stop bad data from reaching the dashboard.
Pharma Secondary-Sales Data Pipeline: 4 Stages, Key Failures & Controls
Stage 1: Ingesting Data from Wholesalers, Distributors, and Vendor Feeds
Stage 1 is the front door. This is where external files get accepted, fingerprinted, and quarantined before parsing.
How Raw Files Enter the Pipeline
Pharma secondary-sales feeds usually show up as flat files dropped into a landing or staging area. Vendors often bundle source data, and they may restate history when panels change, so you need to keep the original file as-is [1][3].
Before parsing starts, check the source identity, feed type, date range, record count, and checksum [1][3][5]. It also helps to structure the landing zone by source, feed type, and ingestion date. That way, late files or resent files don’t get mixed in with the wrong batch [5].
Key ingestion checks are below:
| Ingestion Check | Why It Matters |
|---|---|
Source identification (DATA_SRC_CD, partner cross-reference) |
Maps the file to the correct schema and alignment context |
Unique record IDs (INTEGRATION_ID, DATASOURCE_NUM_ID) |
Prevents duplicate acceptance and supports reload control |
| Required fields | Blocks bad rows before downstream normalization |
| Alignment context | Determines whether the feed resolves to Brick, Zipcode, or Account/Contact |
| Raw artifact retention + checksum | Preserves traceability and detects resent files |
Where Ingestion Breaks First
Most ingestion failures are plain operational problems: late files, missing files, duplicate resends, and quiet schema changes like renamed columns or shifted delimiters [5][7]. This is often where things start to go sideways. A vendor changes its export format and says nothing. A manual file-handling step adds mistakes. Duplicate records from the same source should be rejected using the unique ID [1][3].
Once a file gets through ingestion, the next danger is simple: parsing it wrong when moving it into the canonical model.
Minimum Controls Worth Putting in Place Early
Every file that enters the pipeline should be written once and never overwritten. Pair it with an ingestion manifest that logs the source identifier, arrival timestamp, file hash, record count, and parser version [5].
You should also set partner delivery rules for:
- expected filename patterns
- schedule
- data source codes
When a file doesn’t arrive on time, or it lands with a structure you didn’t expect, an automated alert should fire before anyone pulls a report from partial data [5][7]. A basic dashboard can go a long way here. Track file arrivals against the delivery calendar, rejects, duplicates, and load success by partner. That gives teams a clear view of breakage early enough to act [5].
Those controls only help if they hand clean inputs to the parser; the next stage is mapping source layouts into a canonical model.
sbb-itb-51b9a02
Stage 2: Parsing Feeds into a Canonical Secondary-Sales Model
After a file passes ingestion, the next job is to turn that raw layout into structured records and then normalize those records into one internal model. It helps to keep those as two separate steps. Parsing gives shape to the feed. Normalization makes data from different partners line up.
From Source Layout to Canonical Tables
A common setup uses four layers: raw, bronze, silver, and gold[1]. The raw zone keeps the original file intact for audit and reprocessing. The bronze layer pulls fields into structured records while keeping original field names and values. The silver layer maps source-specific codes to canonical IDs, standardizes units, and links product and customer records to master data. The gold layer publishes reporting tables.
Every output column should keep lineage back to the source file, source field, extraction rule, and transformation path so issues can be traced without replaying the entire pipeline[1]. In the silver layer, keep resale facts, inventory facts, product dimensions, customer dimensions, and territory mappings in separate tables[1][6]. That setup helps contain damage when product or customer mappings change.
The canonical model relies on stable crosswalks for product, customer, time, and geography:
- Product: Source product codes resolve to an NDC and roll up into a four-level product hierarchy: Form/Strength → Product/Brand → Submarket → Market[8].
- Customer: External IDs like DEA, HIN, and GLN cross-reference to internal account IDs.
- Time and geography: Period codes normalize to a standard
PERIOD_TYPE_WID[1]. Geography normalizes to the lowest available grain, usually ZIP code or Brick, and then rolls up into territory hierarchies[1].
Mapping Problems That Cause Bad Data Downstream
The most common failure is unit-of-measure mismatch. Indirect sales units need to be multiplied by a package factor (CONV_FACTOR) to get the true unit count. If 1 carton contains 24 bottles, that equals 24 units, not 1[1][6]. Miss that conversion, or apply it one way for one partner and another way for someone else, and your volume totals drift fast.
Another common issue is stale product mappings. When a new NDC launches, it may not be in the cross-reference table yet. That can understate launch volume until the mapping table is updated. Then there’s ship-to/bill-to confusion. A wholesaler’s distribution center is not the same as the final retail destination, and treating it that way can push sales to the wrong account and territory[1].
| Mapping Problem | Root Cause | Downstream Effect |
|---|---|---|
| UoM mismatch | Missing or misapplied CONV_FACTOR |
Inflated or deflated volume totals |
| Stale NDC mapping | New product not yet in cross-reference | Understated launch volumes |
| Ship-to/bill-to confusion | Distribution center treated as end customer | Wrong account and territory attribution |
| Partner-specific field meanings | Source definitions not documented per partner | Incorrect unit or dollar values |
Once the model is canonical, the next risk is data that looks fine on the surface but fails validation or reconciliation.
Stages 3 and 4: Validation and Reconciliation Before Reporting
Parsing made the data usable. These next stages decide whether it’s safe to publish.
Once records are in canonical form, validation checks whether the data is structurally sound. Reconciliation checks whether that same data still fits the business picture before it shows up in reporting.
Validation Rules That Catch Both Obvious and Subtle Errors
Validation catches records that are structurally wrong, internally inconsistent, or out of sync with master data.
Structural checks come first. Required fields like DATASOURCE_NUM_ID, DATA_SRC_CD, INTEGRATION_ID, and START_DT need to exist. Dates need to follow YYYYMMDD. And the combination of INTEGRATION_ID + DATASOURCE_NUM_ID has to stay unique [1][3]. External product and account IDs also need to resolve before a record is accepted [6][1].
Then come the logic checks. This is where you catch the stuff structure alone won’t spot. Plausibility rules flag quantities that fall outside expected ranges. Consistency rules make sure regional subtotals roll up cleanly to parent totals [5]. Geographic lookups against W_GEO_D confirm that ZIP codes and bricks map to the right cities, states, and countries [1][3].
When a record fails, quarantine it instead of deleting it. Silent deletion wrecks the audit trail [3][5]. It also helps to assign each rule a severity level – critical, warning, or informational – so the pipeline knows when to stop and when to just flag an issue. Publishing should stay gated: no record should reach a dashboard until it passes completeness, plausibility, and consistency checks [5].
A record can pass all of that and still be wrong in business terms. That’s where reconciliation comes in.
Reconciliation Against Master Data and Financial Signals
Reconciliation checks secondary sales against primary shipments, claims, and territory mappings. When those layers don’t line up, the gap often points to stocking or destocking periods that can skew financial reporting [4].
Payer claims data gives you another comparison point, but there’s a catch: it usually lags the actual dispense event by 60 to 90 days [4]. It can also help rebuild net realized revenue, because net price often drifts from Wholesale Acquisition Cost (WAC) due to rebates and co-pays [4].
Without solid MDM logic, one molecule can show up as dozens of separate records across dosage forms, package sizes, and rebate tiers [4]. Territory alignment tables like W_ALIGNMT_DH tie sales positions to specific geographies and accounts, which makes sure secondary sales land with the right rep and territory [1][3].
There’s another wrinkle. Syndicated data vendors such as IQVIA often restate historical projections every month as their panels shift [1]. So incremental loads by themselves may not cut it. In some cases, you need full historical refreshes. And every reported value should keep lineage back to the source file, the rule that touched it, and the full transformation path [5].
Failure Types by Stage: A Quick-Reference Table
The table below sums up the main failure modes by stage.
| Pipeline Stage | Common Failure Modes | Business Impact | Minimum Control |
|---|---|---|---|
| Ingestion | Missing files, version mismatch, corrupted transfers | Reporting gaps, stalls | Checksums, intake queue, manifests [5][2] |
| Parsing | Layout changes, type mapping errors, date format errors, NDC mapping errors | Data corruption, downstream logic failure | Schema validation, format enforcement, deterministic mapping tables [6][3][4][5] |
| Validation | Out-of-range quantities, duplicate INTEGRATION_ID/DATASOURCE_NUM_ID, invalid date logic, silently dropped records |
Double-counting, dirty dashboards | Plausibility thresholds, unique indexes, quarantine queue, severity levels [1][5] |
| Reconciliation | Unresolved product/customer IDs, primary/secondary mismatch, territory alignment gaps, restatement volatility | Broken lineage, financial reporting errors, incorrect incentive compensation | MDM cross-referencing, alignment tables, full historical refreshes [4][1][3] |
Conclusion: What a Reliable Secondary-Sales Pipeline Looks Like
The pipeline only works when each stage hands off clean inputs to the next: ingestion that preserves raw evidence, schema-aware parsing that normalizes messy source data, layered validation that gates publishing, and reconciliation that keeps every output traceable back to its source. If one link breaks, the error moves downstream and shows up in reports.
Use immutable raw storage, normalized intermediate tables, and published metrics so every change stays auditable. Ingestion controls are the base, not extra process. If you add integrations before the pipeline is stable, you multiply the errors that already exist. Missing MDM logic can make a single molecule show up as dozens of separate records [4], and vendor restatements can force full historical refreshes instead of simple incremental loads [1][3]. That’s the line between a reporting stack and a reliable secondary-sales pipeline.
FAQs
Why is a canonical data model so important?
A canonical data model gives pharma secondary-sales pipelines one shared structure for sales, prescription, and CRM data coming in from different sources.
That matters because different systems often label the same thing in different ways. One source might use one term, another might use a different ID, and a third might sort records under a different class. By standardizing terms, IDs, and classifications, a canonical model cuts down on inconsistencies that can get in the way of analysis and slow down decision-making.
It also helps with accurate identity resolution. For example, it can match the same healthcare provider across multiple systems, even when those systems store that provider differently. The result is interoperable data that teams can actually use together, instead of a bunch of disconnected silos.
When should a pipeline trigger a full historical reload?
A pipeline should trigger a full historical reload when syndicated data suppliers restate past data after changing their source projections.
This matters even more when physician and pharmacy panel makeup shifts from month to month. In that situation, an incremental load won’t cut it. You need a complete refresh to keep warehouse data and reporting accurate.
How do teams decide whether to quarantine or publish questionable records?
Teams make these calls with predefined validation plans and business rules. If a record fails checks for quality, logic, completeness, or consistency, it gets flagged as a discrepancy. In most cases, that record is quarantined for investigation instead of being published.
In regulated settings, uncertainty is tracked as metadata. That can include confidence levels or source identifiers. The point is simple: support transparency, traceability, and audit requirements before the data moves downstream.


Leave a Reply