
Dependency Graph Mapping Before a Modernisation: Why It Always Changes the Timeline Estimate
Taher Pardawala June 12, 2026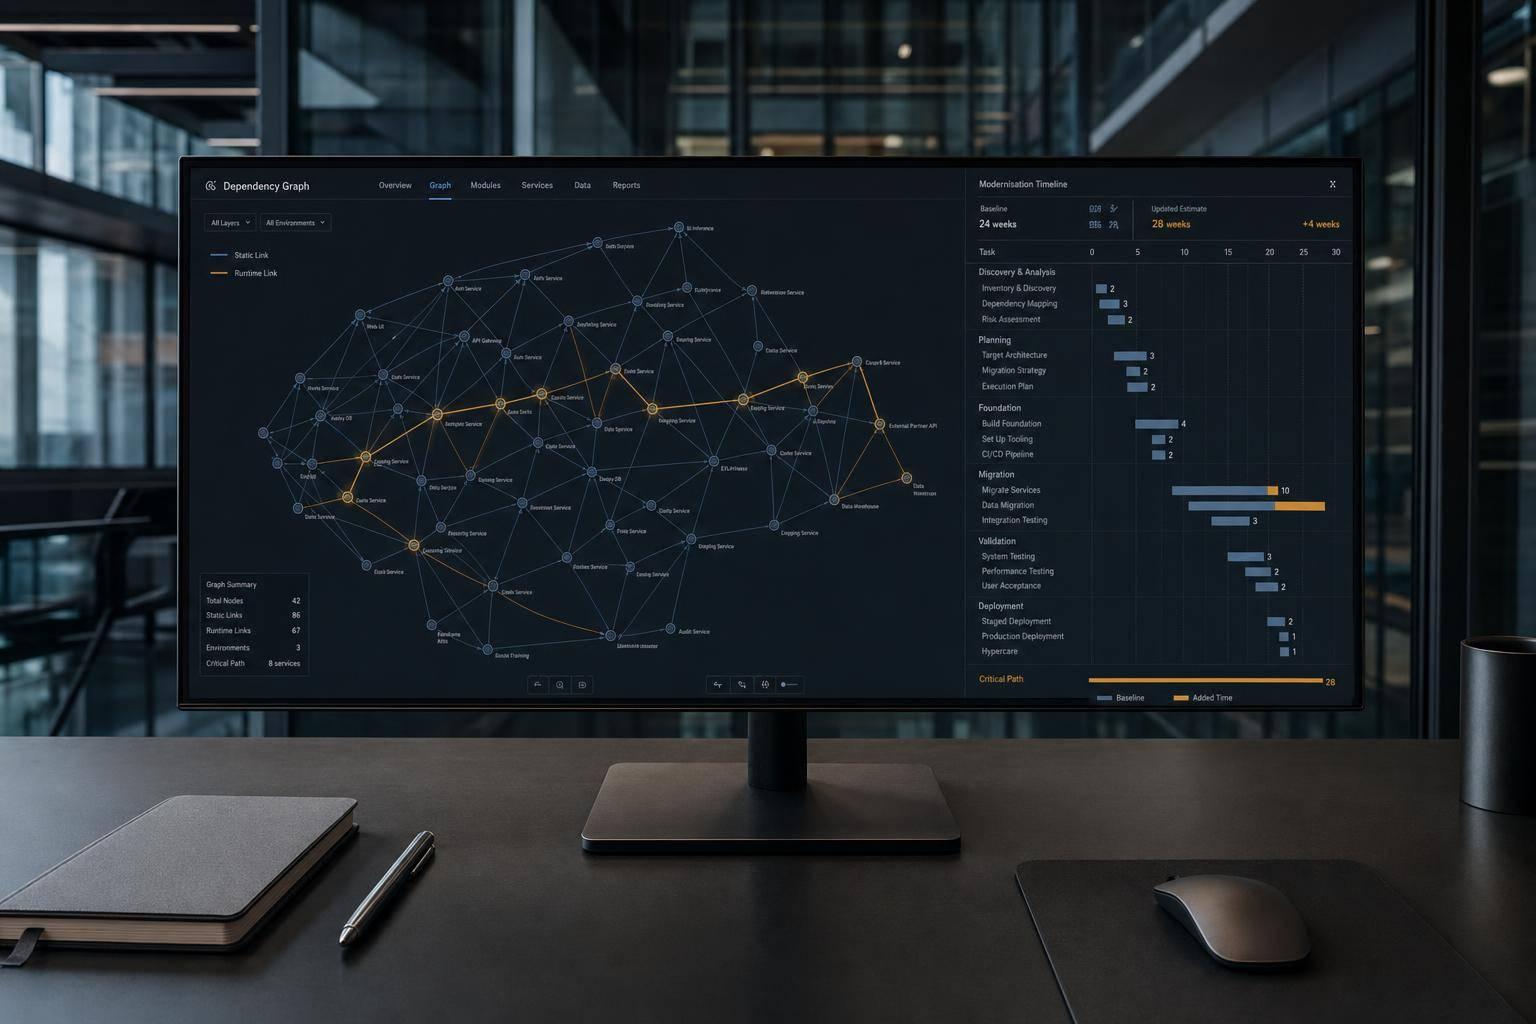
When modernizing legacy systems, timeline estimates often fail due to hidden complexities in dependencies. Most scoping methods focus only on static code dependencies, ignoring runtime behaviors, shared data, and undocumented connections. This oversight leads to surprises mid-project, causing delays and cost overruns.
Key takeaways from the article include:
- Dependency Mapping Layers: Effective mapping spans five layers – Static, Runtime, Data, Temporal, and Semantic. Most teams only address the Static layer, missing critical risks.
- Hidden Dependencies: Runtime behaviors, shared database tables, and undocumented integrations often derail projects.
- Real-World Impacts: Missed dependencies can extend timelines significantly. For example, a planned 3-month project turned into 14 months due to 847 hidden dependencies.
- Tools and Techniques: Combining static analysis (e.g.,
dependency-cruiser,pipdeptree) with runtime monitoring (e.g., OpenTelemetry, Jaeger) provides a complete dependency picture. - Modernization Prioritization: Dependency graphs reveal critical modules (hubs, bridges, leaf nodes) that dictate the order of modernization efforts.
- Timeline Adjustments: Adding buffers for hidden dependencies and focusing on stabilization early prevents delays.
The article emphasizes that dependency mapping isn’t optional. It’s a crucial step to uncover risks, create realistic timelines, and ensure modernization success.
Why Surface-Level Inspections Miss Critical Dependencies
The Limits of Traditional Scoping Methods
When teams start scoping projects, they usually rely on documentation, package manifests, and input from experienced engineers. While this feels like a solid starting point, it often leaves critical gaps.
The problem is that documentation goes out of date quickly, and architecture diagrams rarely match how systems actually behave. Static analysis tools only capture how code is designed, not how it operates in real-world conditions. Plus, modern coding practices like dependency injection, reflection, and dynamic imports don’t show up in files like package.json or requirements.txt. This means key dependencies are easily overlooked. And it’s not just code – cron jobs, deployment scripts, and feature flags can also introduce runtime dependencies that traditional scoping methods miss entirely.
"Operational coupling is not a static property of code; it is a statement about which paths actually run together in production. Misreading references as behavior inflates impact estimates and obscures the real risks engineers must manage." – Giladalfasi, overcast blog [7]
Another hidden pitfall is zombie imports – modules that are included in code but never actually used. These can make the scope of a project look much larger than it really is, inflating estimates and masking the true risks. Ignoring these hidden dependencies often leads to increased project complexity and costs, as the next section explains.
The Cost of Missed Dependencies
The flaws in traditional scoping methods become painfully clear when missed dependencies cause mid-project blockers, emergency fixes, and ballooning timelines.
Take this example: a team planned to migrate a monolith to microservices, estimating it would take three months. They initially identified four independent modules. But a deeper analysis uncovered 847 cross-module dependencies that weren’t visible in the static import graph. The project ended up taking 14 months instead [4].
A common issue is data-level coupling, where two services might not share any code but are tightly linked through a shared database table or cache key. A schema change in one service can silently break another, completely unrelated one.
"The problem wasn’t that the codebase was badly written. The problem was that nobody had mapped the actual dependencies. Everyone had a mental model of how things connected, and every mental model was wrong in different ways." – CodeIntelligently [4]
Another challenge is change amplification. For instance, in one case, upgrading Django 1.11 affected 127 modules directly and 341 modules transitively. This blocked 89 modules from upgrading until each dependency was addressed individually [3]. None of this was apparent during the initial scoping process.
These examples highlight a recurring pattern: the dependencies that derail projects are almost always the ones that traditional methods fail to detect. They lurk in runtime behavior, shared resources, and infrastructure layers – areas that surface-level inspections simply don’t cover.
sbb-itb-51b9a02
Rethinking legacy modernisation with automated reasoning and comprehension models – XConf India 2025
Hidden Dependencies That Only Appear at Runtime
Static dependency mapping can show you the structure of your code, but it doesn’t tell the full story. The real challenges, the ones that derail modernization projects, often come from dependencies that only show up when your system is running. These are the "hidden" dependencies that aren’t visible in import statements or package manifests. Let’s break down some of these tricky runtime behaviors.
Implicit Shared State and Data Coupling
Two services might seem independent on the surface but can be deeply intertwined if they both rely on the same database, cache, or global resource. This kind of data coupling can create big problems during modernization. For example, teams might define service boundaries on a whiteboard, only to discover later that critical resources are shared between services. By then, infrastructure has been provisioned, teams have reorganized, and fixing the issue becomes a costly headache.
Here’s a common scenario: Imagine the "Billing" module quietly reading from a table owned by "Orders" for years. Nobody notices until it’s time to modernize, and by then, untangling that dependency might require months of work.
"Data coupling that isn’t visible in the import graph is one of the most common reasons whiteboard-defined service boundaries fail." – PViz Blog [8]
The table below highlights some typical forms of implicit shared state and why they’re so hard to spot early:
| Dependency Type | Why It’s Hidden | Impact on Modernization |
|---|---|---|
| Shared Database Table | Lives in the data layer, not the code | Requires unexpected data migration or sync logic |
| In-Memory Cache / Singleton | Only shows up during runtime | Cache state from one module impacts others |
| Scheduled Jobs | Operates on specific time schedules | Issues only appear during scheduled runs |
Beyond data-level coupling, other hidden dependencies can emerge when systems handle live traffic.
Undocumented Service and Integration Dependencies
Over time, undocumented dependencies creep into even the best-designed systems. Maybe an internal service starts calling an endpoint without formal documentation. Or a third-party integration gets configured by someone who’s no longer around. Perhaps a batch job is set up and promptly forgotten. These don’t show up in any architecture diagrams.
The only way to uncover these dependencies is through runtime analysis. Tools like OpenTelemetry, Jaeger, or service mesh sidecar analysis (e.g., Istio or Linkerd) can help. Reviewing at least 90 days of logs is essential, especially for catching jobs or processes that run on rare schedules – like a reconciliation script that kicks off at 2 AM on the last Sunday of the quarter. A shorter log review won’t catch these.
"A proxy that routes traffic between two services you understand well is a migration tool. A proxy that routes traffic between a new service and a legacy system nobody fully understands is a liability." – Shlomo Friman, Founder, IN-COM Data Systems [10]
Configuration-Driven Behavior and Feature Flags
Static analysis tools can identify imports and function calls, but they miss external factors like environment variables, configuration files, or feature flags that only take effect during runtime [1][11]. These hidden configurations can trigger entire execution paths that remain invisible during development, leading to unexpected issues.
Take this example: In March 2026, a team refactored a utility library used by multiple microservices. They relied on static analysis to identify dependencies, searching for terms like "tax." What they missed was a quarterly cron job that applied a legacy rounding rule through the utility. After deployment, invoice calculations became inconsistent because the rule depended on specific input constraints tied to an old data migration. None of this was visible in the main code paths [7].
"Modernization programs overestimate code translation and underestimate comprehension because dependency mapping and hidden-behavior discovery determine whether change stays rollback-safe." – Augment Code [9]
To avoid these pitfalls, instrument legacy systems before migrating them. This isn’t just about catching errors; it’s about understanding how the system behaves under different configurations. Running a new service in shadow mode with real production traffic before fully switching over is one of the best ways to uncover these hidden behaviors [10].
Tools and Techniques for Deep Dependency Mapping
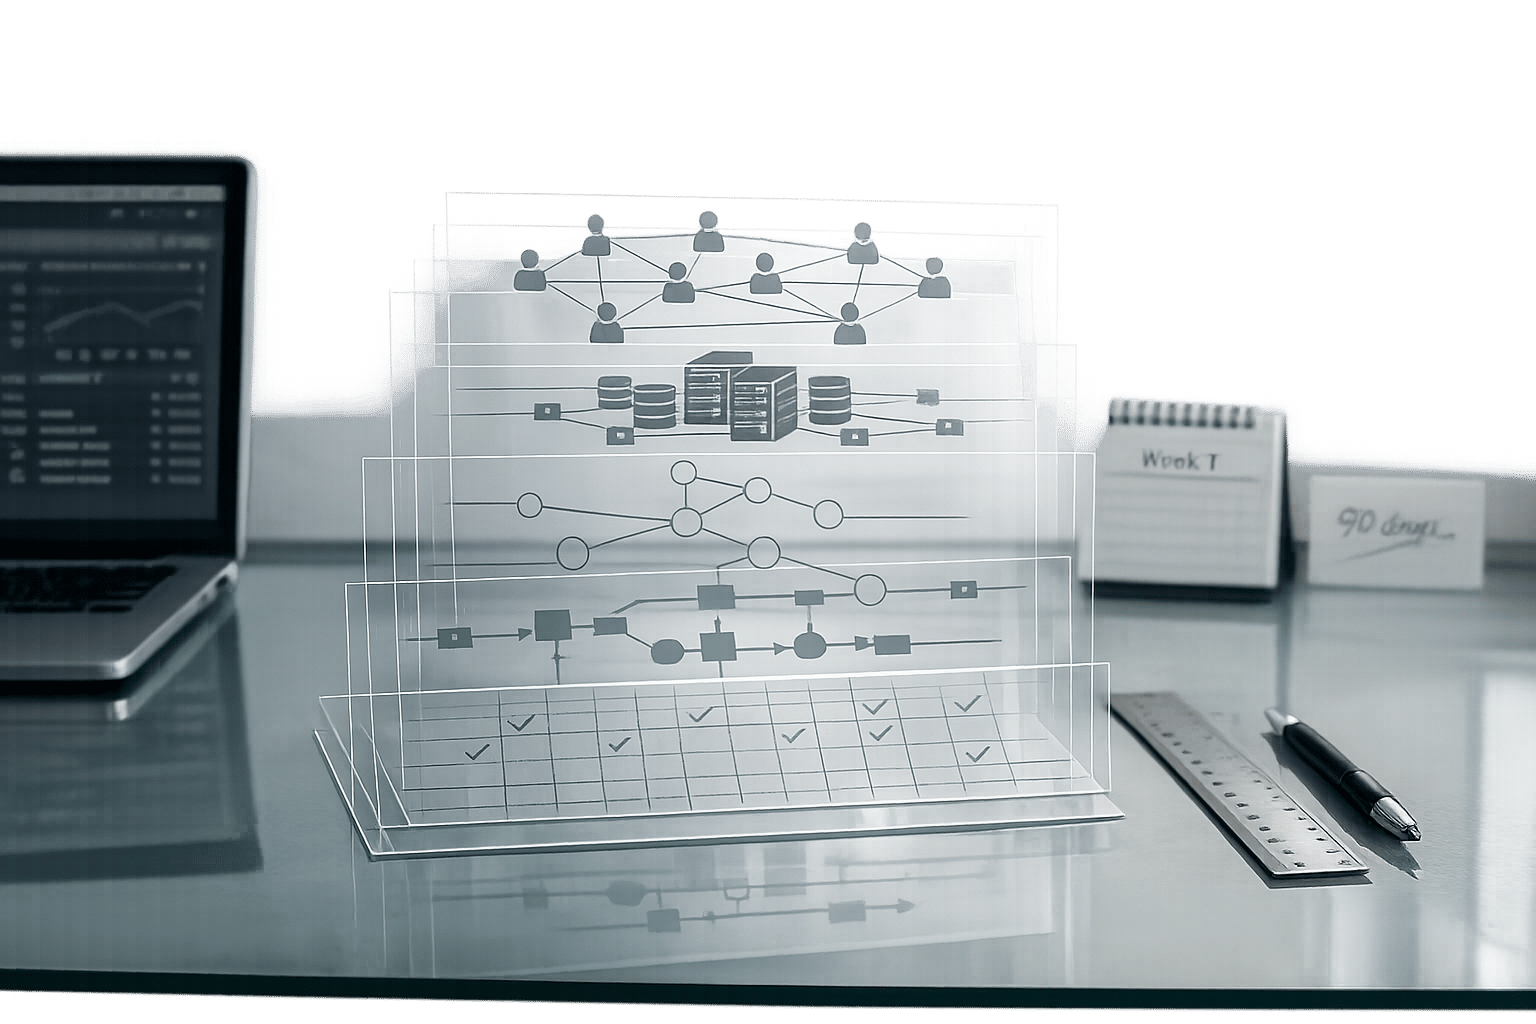
Static and Runtime Mapping: The Layered Approach
To create a thorough dependency map, you need to combine static analysis, runtime monitoring, and infrastructure configuration. Each layer contributes a unique perspective: static analysis shows what the code claims to do, runtime monitoring reveals what actually happens under load, and infrastructure configuration explains where and how the code operates. Neglecting any of these layers can leave gaps that may lead to delays or unexpected issues.
Static analysis is quick and doesn’t require running the code. It focuses on parsing import statements, build manifests (like pom.xml or package.json), and Infrastructure-as-Code files (such as Terraform configurations). On the other hand, runtime monitoring uses tools like distributed tracing and service mesh data to uncover what’s really happening in production. This includes dynamic imports, dependency injection, reflection-based calls, and third-party API interactions that static tools might miss. These gaps can create roadblocks during modernization projects. Below, we explore tools tailored to specific programming languages that apply this layered approach.
Language-Specific Mapping Techniques
Different programming languages require specific tools to expose hidden dependencies effectively.
| Language | Static Analysis Tools | Runtime Analysis Tools |
|---|---|---|
| JavaScript/TypeScript | dependency-cruiser, madge, npm ls |
OpenTelemetry, Jaeger, Istio |
| Python | pipdeptree, pydeps, pyreverse |
OpenTelemetry, Orbits (Python trace) |
| Java | mvn dependency:tree, jdeps, gradle dependencies |
JVM Profiling, OpenTelemetry, SkyWalking |
For JavaScript and TypeScript, tools like dependency-cruiser are excellent for enforcing architectural rules, such as ensuring the UI layer doesn’t directly access the data layer [4]. Meanwhile, madge is great for visualizing dependency graphs, though it doesn’t support rule validation. Pairing these tools with OpenTelemetry helps capture runtime behaviors like dynamic imports and API calls.
In Python, pipdeptree is invaluable for mapping the entire dependency tree, including indirect imports. To simplify complex outputs, tools like visualpy can translate library names into more descriptive terms (e.g., converting boto3 into "AWS S3") [1][13]. This is especially helpful when dealing with older codebases where library names might not clearly indicate their purpose.
For Java, tools such as mvn dependency:tree or gradle dependencies offer build-level insights, while jdeps provides more detailed class-level analysis. Runtime tools like JVM profiling and OpenTelemetry are essential for identifying dynamic behaviors, such as class loading and reflection, that static analysis might overlook – especially in older Spring-based systems [6].
Another universal technique is change coupling analysis. If two files are updated together in 80% of commits over the past year, they likely share a hidden dependency, even without direct imports [12]. Tools like ripgrep can highlight shared database tables or cache key patterns that static analysis might miss entirely. This approach helps identify implicit connections that could otherwise go unnoticed.
By combining these tools and techniques, you can bridge the gap between static and runtime analysis for a more complete understanding of your system’s dependencies.
Static vs. Runtime Analysis: A Direct Comparison
Static and runtime analyses each have strengths and limitations. Here’s a side-by-side look to help you decide where to focus your efforts:
| Feature | Static Analysis Only | Combined Static + Runtime |
|---|---|---|
| Signal Quality | Shows potential connections (e.g., imports, AST) | Reveals actual execution paths (e.g., traces, logs) |
| Time Cost | Low – runs in seconds or minutes | High – requires instrumentation and monitoring over time |
| Coverage | Analyzes all source code, even dead code | Limited to executed code paths |
| Dynamic Discovery | Misses dynamic imports, reflection, and dependency injection | Captures these dynamic resolutions |
| Infrastructure | Doesn’t rely on operational environments | Requires a live environment with tracing or sidecars |
| Best For | Quick scoping, linting, and identifying structural issues | Assessing impact, analyzing risks, and handling incidents |
Start with static analysis to establish a baseline map of dependencies. Then, enhance it with runtime tracing over a representative production period. The differences between static and runtime insights will reveal potential risks and blind spots in your system.
"The static graph is technically correct and practically useless… A real knowledge graph combines static analysis, runtime data, and human context." – CodeIntelligently [12]
How Dependency Graphs Change the Order of Modernization Work
Once a complete dependency map is in hand, the sequence of modernization work often takes an unexpected turn. What might initially seem like a simple rewrite evolves into a staged approach, where stabilizing critical components comes first, and rewrites are deferred. This shift underscores the value of the mapping process.
Identifying Hubs, Bridges, and Leaf Nodes
A dependency graph reveals three key component types that directly influence modernization priorities:
- Leaf nodes: These are modules with minimal or no incoming dependencies. Because they have a small blast radius, changes to them are unlikely to disrupt other parts of the system. They’re an ideal starting point, allowing teams to make progress without causing widespread failures.
- Hub modules: These components are highly interconnected, with many others depending on them (high afferent coupling). If a hub fails, the impact can cascade across the system. To minimize risk, hubs should be stabilized first. This involves adding characterization tests, improving observability, and breaking down oversized "grab-bag" modules into smaller, more focused ones. Modules with more than 10 direct dependents should be prioritized for stabilization [4].
- Bridges and seams: These components act as connection points, with clear input/output contracts and limited shared state. They are prime candidates for inserting routing layers or proxies to enable phased migrations, such as a Strangler Fig pattern [14][5]. Circular dependencies, which prevent independent testing or deployment, should be resolved by extracting shared logic into separate modules [4].
This classification is crucial for determining which components to address first in a modernization plan.
Triage and Prioritization Using the Traffic Light Framework
Identifying hubs, bridges, and leaf nodes is just the first step. The next involves prioritizing them effectively. AlterSquare‘s Traffic Light Roadmap, part of its AI-Agent Assessment, categorizes components into Critical, Managed, or Scale-Ready, based on three factors: business importance, degree of coupling, and failure risk.
- Critical components: These are high-coupling, high-impact modules. They demand immediate attention, focusing on stabilization, test coverage, and establishing data contracts before any rewrites occur.
- Managed components: These have moderate coupling and risk. They can be addressed incrementally as the project progresses.
- Scale-Ready components: These are low-risk modules, often leaf nodes or new seams. They’re safe to refactor or extend without significant precautions.
This framework ensures modernization efforts are aligned with strategic priorities rather than technical curiosity. The dependency graph validates these decisions, helping teams avoid common pitfalls.
How Dependency-Informed Planning Affects Timelines
When planning is guided by dependency data, timelines are reshaped by prioritizing stabilization early on. The statistics are striking: two-thirds of legacy modernization projects miss their deadlines, with initial scoping uncovering only about 20% of a system’s true complexity [15]. The remaining 80% – hidden technical debt, undocumented dependencies, and shared database tables – tends to surface mid-project, derailing original plans.
"The problem isn’t bad estimates. It’s that initial scoping only reveals about 20% of what you’re actually dealing with." – Austin Reed, CEO, Horizon Dev [15]
A Practical Dependency Mapping Protocol
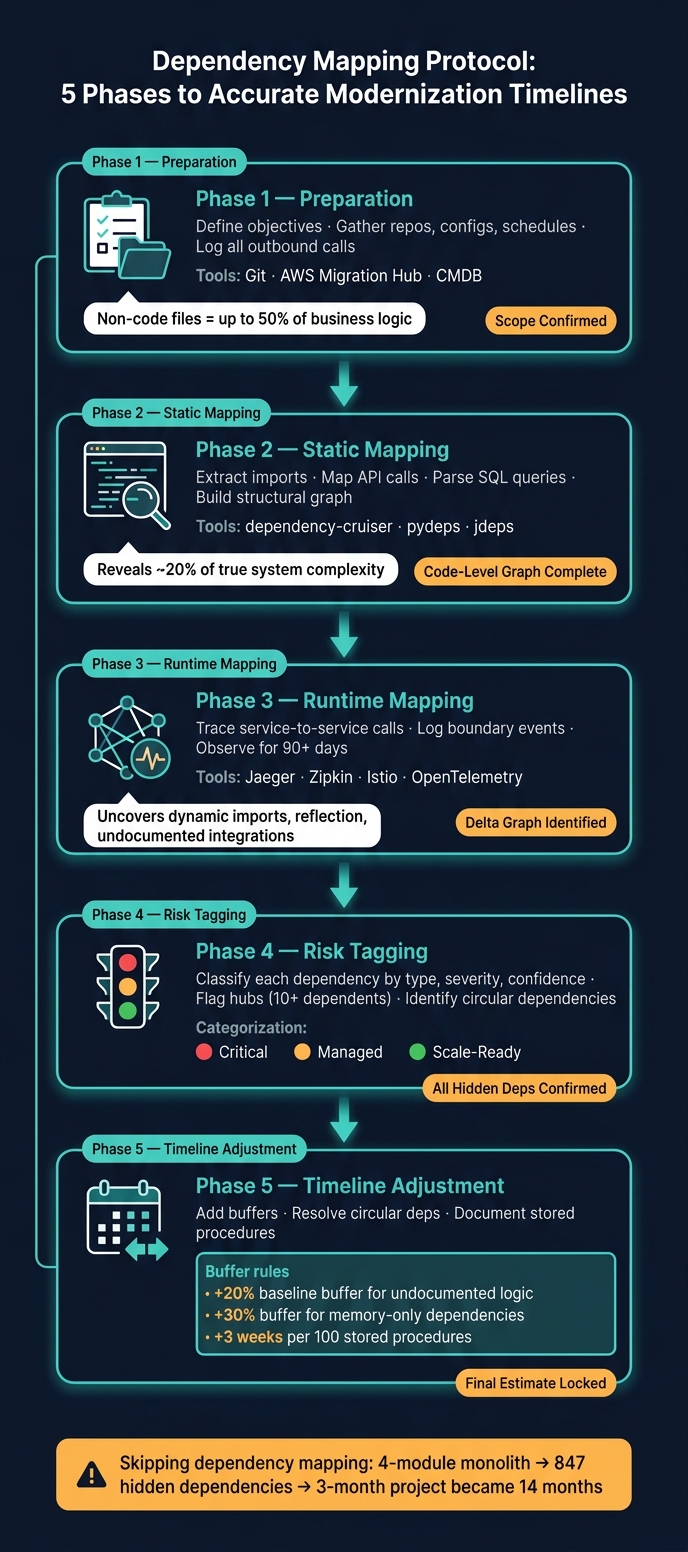
Dependency Mapping Protocol: 5 Phases to Accurate Modernization Timelines
To avoid schedule disruptions caused by hidden dependencies, having a clear, repeatable process is crucial.
Preparation and Data Collection
Start by defining your modernization goals. Whether you’re splitting a monolith, migrating to the cloud, or replacing a database layer, your objectives will determine which dependencies are most critical. Then, gather every artifact you can find. This includes code repositories, infrastructure configurations, API contracts, environment variable files, and even non-code artifacts like job schedules and transaction maps. For older systems, non-code files can account for up to 50% of the actual business logic [2], so skipping these could leave you with an incomplete picture. As mentioned earlier, make sure to log all outbound calls to databases, file systems, and third-party APIs across every entry point before diving into the analysis.
Static and Runtime Mapping Phases
Once you’ve collected all artifacts, the next step is to combine static and runtime mapping to get a complete picture of your dependencies.
Begin with static analysis. This involves using tools like dependency-cruiser (JavaScript), pydeps (Python), or jdeps (Java) to scan your codebase. These tools extract information about import statements, module relationships, and embedded SQL queries [4], creating a graph that reflects your system’s intended architecture. However, static tools can’t catch everything, which is where runtime mapping comes in. Use distributed tracing tools like Jaeger or Zipkin, or a service mesh like Istio, to capture real service-to-service calls during a representative observation period [4][11]. The difference between what static analysis shows and what runtime mapping reveals often highlights critical risks. To ensure thorough coverage, add structured logging at module boundaries and collect logs for at least a week to capture rare code paths [4].
"Operational coupling is not a statement about code; it is a statement about which paths actually run together in production." – Giladalfasi, Cloud-Native Engineer, Overcast Blog [7]
Combine the results of both analyses into a single, unified graph. Focus on packages or services as nodes rather than individual files to avoid overwhelming complexity – graphs with over 1,000 nodes can obscure more than they reveal [7]. This consolidated view is essential for identifying risks and adjusting timelines in the next steps.
Risk Categorization and Timeline Adjustment
Hidden dependencies uncovered through runtime mapping often require additional buffers in your timeline. Start by tagging each dependency based on its type, severity, and confidence level. Dependencies confirmed through static analysis, runtime traces, and logs should undergo standard testing. Those identified only through developer memory need a manual audit and an added 30% buffer [7]. Across the entire project, apply a baseline 20% buffer for undocumented business logic and hard-coded configurations that tools won’t detect [15].
Here’s a quick checklist summarizing the key phases and activities:
| Phase | Key Activities | Tools | Timeline Trigger |
|---|---|---|---|
| Preparation | Define objectives, gather repos, configs, schedules | Git, AWS Migration Hub, CMDB | Scope confirmed |
| Static Mapping | Extract imports, API calls, SQL queries | dependency-cruiser, pydeps, jdeps | Code-level graph complete |
| Runtime Mapping | Trace service calls, log boundary events | Jaeger, Zipkin, Istio, OpenTelemetry | Delta graph identified |
| Risk Tagging | Classify dependencies by type, severity, confidence | Confidence Scale (High/Med/Low) | All hidden deps confirmed |
| Timeline Adjustment | Add buffers, flag hubs, address circular dependencies | Dependency Decision Matrix | Final estimate locked |
Pay close attention to two common issues that can derail timelines: hub modules and circular runtime dependencies. Hub modules with more than 10 direct dependents require stabilization – this means running characterization tests and adding observability – before starting any rewrites. Circular runtime dependencies must be addressed immediately, as they can trigger cascading failures that are nearly impossible to debug during migration [4]. Also, keep in mind that every 100 stored procedures typically adds about three weeks to the timeline, so document them as you go instead of treating them as an afterthought [15].
Conclusion: Dependency Mapping Is Not Optional
Modernizing any system effectively starts with a clear, accurate map of its dependencies. Estimates are only as reliable as the data they’re based on. When teams skip this critical step and instead rely on outdated documentation or mental shortcuts, they’re essentially guessing at project timelines without fully understanding the complexities beneath the surface.
The risks of skipping dependency mapping aren’t hypothetical – they’re well-documented. Take the example of a monolith initially thought to contain just four modules. Upon closer inspection, it revealed hundreds of hidden dependencies [4]. Projects like this often spiral far beyond their original scope once these unseen complexities come to light [4]. These scenarios aren’t rare – they’re the natural consequence of overlooking a step that should be a standard practice.
"Dependencies are the skeleton of your architecture. Once you see them clearly, everything else makes more sense." – CodeIntelligently [4]
Dependency mapping isn’t just about getting the project started on the right foot. It’s a process that should continue throughout modernization. By incorporating static and runtime analysis into CI/CD pipelines, teams can ensure that dependency mapping serves as a constant safeguard. This approach helps catch issues early, long before they make it into production.
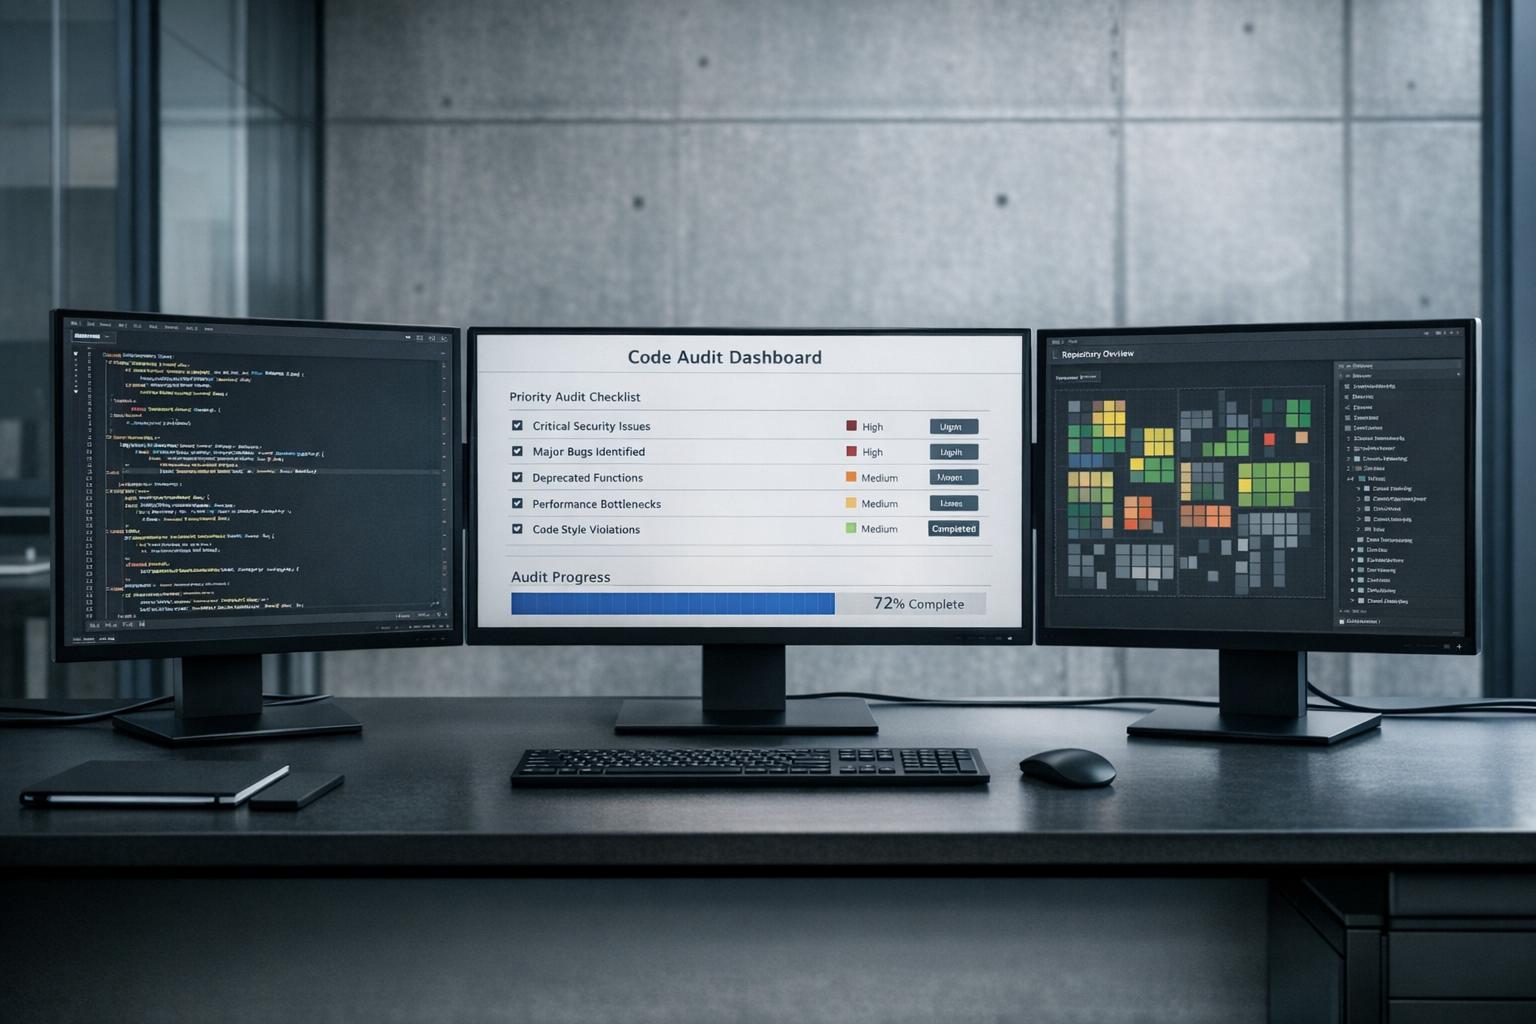
At AlterSquare, this practice is baked into the foundation of every modernization project. Their Principal Council – Taher, Aliasgar, Rohan, and Huzefa – employs proprietary AI agents to scan codebases and produce a detailed System Health Report. This report highlights architectural coupling, tech debt hotspots, and security vulnerabilities, feeding directly into a Traffic Light Roadmap that categorizes risks as Critical, Managed, or Scale-Ready. For tech-driven companies, this level of insight isn’t optional – it’s essential for success.
FAQs
How long should runtime tracing run to find rare dependencies?
Runtime tracing usually lasts 2 to 3 weeks. This timeframe is essential for identifying rare or hidden dependencies that might only surface under certain conditions. These could include things like undocumented service calls, shared states that aren’t explicitly defined, or behaviors influenced by specific configurations. Giving the process enough time helps create a more complete dependency map, which is crucial for precise scoping.
What hidden dependencies won’t show up in import graphs?
Hidden dependencies can be tricky to spot because they often reveal themselves only during runtime or through less obvious connections. These include:
- Runtime dependencies: Think of things like dynamic imports, reflection, or dependency injection, which aren’t always visible in the code until they’re executed.
- Data dependencies: These come from shared resources like databases, caches, or message queues, where multiple systems interact indirectly.
- Temporal or semantic dependencies: These involve execution order or implicit agreements on data formats that aren’t explicitly outlined in the code.
To identify these hidden links, you’ll need to go beyond just static code analysis. Pair it with runtime tools such as distributed tracing and network analysis. These methods help reveal interactions that import graphs alone might miss.
Which modules should be modernized first from the dependency graph?
Modules that offer high business value with low technical risk should take priority. Focus first on components with minimal dependencies, well-defined boundaries, and low complexity. Examples include internal admin screens or stable, non-critical modules. These are less prone to hidden dependencies, which helps avoid delays. To ensure a smooth and efficient modernization process, invest time in creating a detailed dependency graph.


Leave a Reply