

AI systems aren’t like traditional software. They can fail silently – producing biased, inaccurate, or outdated results – even when everything seems to be running fine. This makes monitoring AI models far more complex.
Key takeaways:
- AI failures are subtle: Models can drift over time, degrade in performance, or return biased outputs without triggering standard alerts.
- Unique metrics are necessary: Traditional tools track uptime and errors but miss critical AI-specific issues like data drift, bias, or hallucinations.
- Monitoring layers: Effective systems track input data quality, model performance, real-time outputs, and business impact.
- Tools to use: Combine platforms like MLflow (for experiments) and Prometheus (for real-time system health) to monitor AI holistically.
The stakes are high – 85% of machine learning deployments fail post-launch due to issues like model drift or unseen biases. But with the right strategies, tools, and metrics, you can ensure your AI systems remain reliable and aligned with business goals.
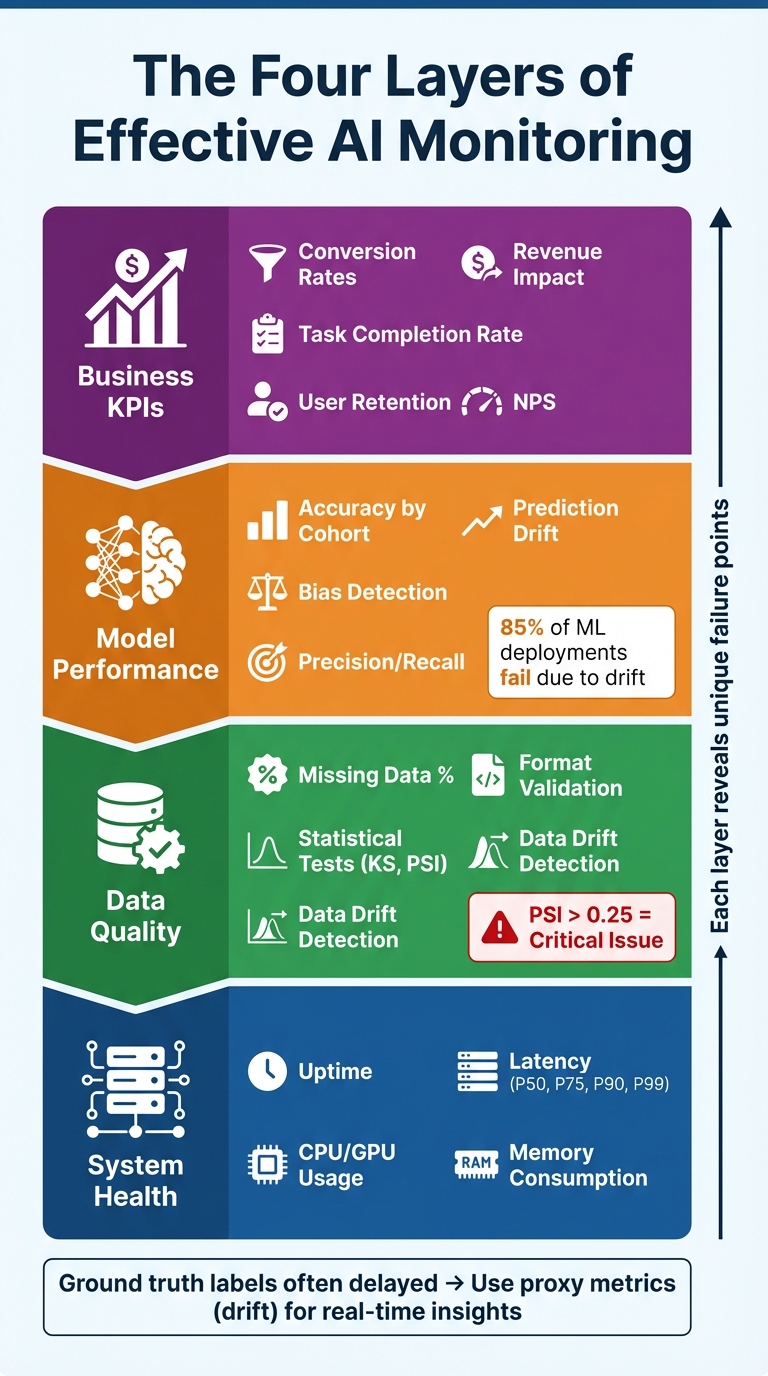
Four-Layer AI Monitoring Framework: System Health to Business Impact
Challenges of Monitoring AI Features
Model Drift and Data Distribution Shifts
Model drift is one of those sneaky challenges that can erode a model’s accuracy without throwing obvious red flags. It happens when data changes or the relationship between inputs and outputs shifts. For example, concept drift occurs when something fundamental changes – like consumer behavior dramatically shifting during a pandemic. On the other hand, data drift happens when the statistical makeup of the input data changes. A simple case? A new demographic starts using your app, which alters the input data, even though the model’s logic remains unchanged.
The consequences can be serious. DoorDash experienced this firsthand when outdated models started making poor predictions, negatively affecting both their operations and customer experience. Their engineering team admitted, "Finding this kind of model drift took a long time because we did not have a way to monitor for it" [9]. Worse, raw data drift alone often doesn’t directly correlate with performance loss. A study of 580 model-dataset experiments revealed that data distribution changes should be treated as early warning signs rather than definitive proof of failure [7]. This highlights the need to monitor multiple signals across the pipeline to catch drift before it impacts your business.
While drift is a technical challenge, there’s another layer of complexity: the ethical issues tied to bias in AI outcomes.
Bias Detection and Ethical Concerns
AI systems can fail in ways that are harder to detect. They might appear to work just fine – returning a "200 OK" status – while quietly delivering biased or discriminatory predictions. For instance, a model might boast 90% overall accuracy but perform significantly worse, say 60%, for a minority group.
The root of this issue often lies in the training data. AI models can unintentionally amplify biases already present in the data. Take credit scoring systems as an example: they might unintentionally discriminate against certain groups, leading to unfair loan denials. In critical areas like healthcare or education, these biases can have serious, life-altering effects [3].
To address this, tracking performance across specific cohorts – like geography, language, or protected attributes – is essential. Aggregate metrics often hide these disparities. However, real-world challenges complicate this process. In many cases, actual outcomes aren’t available for months, making real-time fairness evaluation incredibly difficult [3].
Here’s a quick look at some key metrics used to monitor bias:
| Metric | What It Measures | Why It Matters |
|---|---|---|
| Disparate Impact | Ratio of positive outcomes by group | Identifies if the model favors one group over another |
| Predictive Parity | Equal true positive rates across groups | Ensures consistent success rates for all groups |
| Equalized Odds | False positives and negatives across groups | Checks if error rates are fairly distributed |
Bias isn’t the only issue demanding attention – subtle signs of performance degradation in real-time outputs also need close monitoring.
Real-Time Inference and Accuracy Metrics
Real-time monitoring plays a critical role in catching early signs of performance problems that might not show up in traditional metrics. Small changes, like slight shifts in latency, irregular token usage, or variations in inference times, can signal deeper issues. These subtle indicators can sometimes foreshadow major accuracy drops by hours or even days [8]. For example, LinkedIn’s engineering team keeps a close eye on latency at multiple percentiles – 50th, 75th, 90th, and 99th – because relying on averages alone can mask bottlenecks that affect specific users [9].
When immediate ground truth labels aren’t available, proxy indicators step in to help gauge model health. In generative AI, for instance, you can monitor metrics like Time to First Token (TTFT) to measure responsiveness, track hallucination rates to assess reliability, and observe embedding drift to detect semantic shifts in outputs. It’s important to remember that even with identical inputs, outputs can vary [4][8]. Keeping a constant watch on these signals ensures that your AI stays aligned with business goals [4].
sbb-itb-51b9a02
Key Metrics for Monitoring AI Performance
Input Data Metrics
The success of your AI model starts with the quality of your data. Keep an eye on missing data – this includes the percentage of null or empty values in your dataset – and ensure all inputs meet the expected format. For example, a third-party API might suddenly switch a date format from MM/DD to DD/MM, which could throw your entire data pipeline off track if unnoticed.
It’s also important to monitor basic statistics like mean, median, and standard deviation, along with key percentiles (P50, P95, P99). These metrics can reveal shifts in your data. To go deeper, apply tests like Kolmogorov-Smirnov or Population Stability Index (PSI) to compare current data with a stable historical baseline. A PSI score above 0.1 suggests a minor change, while anything over 0.25 signals a more serious issue that requires immediate attention [10]. Breaking down metrics by region or user demographic can help detect hidden problems that might not show up in overall data trends.
Model Performance Metrics
After ensuring input quality, it’s time to evaluate how well your model is performing. Relying on aggregate accuracy alone can be misleading. For instance, a model might achieve 90% accuracy overall but drop to 60% for a specific group, such as users in a particular region or those using older devices. This makes it essential to track performance across different segments like location, device type, or demographics [3][9].
Because ground truth labels often take time to collect, proxy metrics like prediction drift can act as early warning signs of performance issues. Prediction drift refers to changes in the distribution of your model’s outputs over time [3][11][9]. Alongside traditional metrics like precision and recall, you can use statistical tests like Kolmogorov-Smirnov (KS), PSI, or Jensen-Shannon (JS) Divergence to detect shifts [6][10].
"Each model is part of a whole machine learning system where data is being preprocessed, predictions are being made, and finally, these predictions are used to influence the day-to-day operations of our business… the entire system needs to be of good quality to ensure long-lasting business impact." – Booking.com’s data science blog [9]
A two-loop monitoring system works well here: a real-time loop using proxy metrics like drift for immediate feedback, paired with a delayed loop that evaluates actual performance once ground truth data becomes available [3]. Together, these approaches provide a comprehensive view of your model’s health.
Output Quality and User Experience Metrics
AI performance isn’t just about technical accuracy – it’s also about how well your model’s outputs meet user needs. For generative AI systems, focus on metrics like Answer Relevancy (does the response address the input?), Factual Correctness (is the output aligned with verified information?), and Hallucination Rates (how often false information is generated) [13][12].
User experience metrics are equally important. These help determine if your AI is genuinely useful in helping users complete their tasks. Key indicators include Task Completion Rate, User Retention (to spot any novelty effects), and direct feedback mechanisms like NPS scores or thumbs up/down ratings [14][15]. For text-generation models, measuring the average edit distance can quantify how much value the AI adds to user-generated content [15].
On the business side, metrics that tie AI performance to organizational goals – such as increased productivity, cost savings, revenue growth, or improved task automation – are crucial [14][9]. Monitoring GPU utilization, often tracked through prompt and completion token counts, can also help balance performance with cost efficiency [15]. To avoid drowning in data, stick to the "5 Metric Rule": focus on a few custom metrics tailored to your use case (e.g., brand voice consistency) and a handful of generic system metrics (like faithfulness in retrieval-augmented generation) [13].
Tools and Frameworks for AI Monitoring
MLflow for Experiment Tracking
MLflow has established itself as a leading open-source platform for managing AI lifecycles, boasting over 30 million package downloads per month as of February 2026 and more than 23,000 GitHub stars, thanks to contributions from a community of 900+ developers[17]. Supporting more than 100 AI frameworks, MLflow provides a comprehensive system for tracking experiments, managing model versions, and ensuring reproducibility throughout the development process.
The release of MLflow 3 introduced key features for production monitoring. For instance, the mlflow.search_logged_models() function enables SQL-like searches through logged models[16]. By enabling asynchronous trace logging (MLFLOW_ENABLE_ASYNC_TRACE_LOGGING=true), you can minimize latency during operations[19]. For containerized or serverless setups, the lightweight mlflow-tracing SDK offers faster deployment with a reduced resource footprint compared to the full MLflow package[19]. To scale effectively, connect MLflow to a robust SQL database like PostgreSQL or MySQL for metadata storage, and use remote storage solutions such as S3 or Azure Blob for artifacts. For high-volume use cases, implementing trace sampling at a 10% ratio can help balance storage and computational demands while maintaining visibility into system performance[16][19].
Prometheus for Real-Time Monitoring
While MLflow excels at managing AI lifecycle experiments, Prometheus is the go-to tool for real-time system performance monitoring. It collects key metrics such as latency, throughput, CPU/GPU usage, and memory consumption[21]. When integrated with Grafana, Prometheus becomes a powerful stack for visualizing performance, allowing you to track latency at various percentiles (50th, 75th, 90th, and 99th) to identify bottlenecks[2].
"Model inference latency is an important metric for the application owners because this tells the overall time the model took in serving a particular scoring request." – LinkedIn Blog [2]
However, Prometheus alone doesn’t cover AI-specific metrics like drift or bias. To address this, Evidently AI can export such metrics for deeper insights[18][2]. For example, you can use custom Gauge metrics to monitor drift scores and Counter metrics to track total model errors or specific failure types[10]. By linking Prometheus alerts to automated workflows (e.g., with Argo), you can set up immediate responses, such as rolling back a model when accuracy drops below a critical threshold[10].
Custom Dashboards for AI Observability
Combining data from MLflow and Prometheus, custom dashboards provide a centralized view of AI system performance. A well-designed dashboard typically includes four key layers: System Health (e.g., uptime, latency), Data Quality (e.g., integrity checks), Model Quality (e.g., drift, accuracy), and Business KPIs (e.g., ROI, conversions)[2].
Tailor dashboards to the needs of different stakeholders. For instance, data scientists might prioritize metrics like accuracy and drift, while engineers focus on operational metrics such as memory usage and GPU performance[21]. Since ground truth labels often arrive later, proxy metrics like prediction drift or input data drift can serve as early indicators of potential problems[2][20]. Segment data by geography, demographics, or product categories to uncover localized issues that aggregate metrics might miss, such as performance drops or bias in specific user groups[2][22]. Adding user feedback mechanisms, like thumbs up/down ratings, directly within the dashboard can help link model performance to user satisfaction[19][4].
For more complex systems, organize dashboards with tabs to separate areas of focus, such as "Data Quality", "Model Performance", and "Safety/Compliance." Including trace IDs and session metadata allows teams to investigate the reasons behind specific model behaviors, going beyond just identifying what happened[1][19].
Strategies for Reliable AI Monitoring in Startups
Layered Monitoring Across Inputs, Models, and Outputs
Effective AI monitoring involves tracking four key layers: system health (e.g., latency, uptime), data quality, model quality (such as accuracy and drift), and business KPIs (like conversion rates and revenue) [2]. Each layer helps uncover unique failure points. For instance, a model might respond successfully with a "200 OK" status but still produce biased or drifting predictions quietly in the background [1].
Since ground truth labels often arrive with delays, startups can rely on proxy metrics like prediction and input data drift for real-time insights [2][3]. For example, a noticeable shift in the distribution of predicted scores from a recommendation model could serve as an early warning, even before metrics like click-through rates are available. By establishing reference statistics during the validation phase, you can significantly improve drift detection once the model is live [10]. This structured approach enables automated detection and deeper cohort analysis in production environments.
Automated Anomaly Detection and Alerts
Manual monitoring simply doesn’t scale, especially for startups. Automated systems are essential for spotting anomalies in data quality, model outputs, and infrastructure health [1][2]. Statistical methods like Kolmogorov-Smirnov or Chi-square tests can help detect data drift, while dynamic thresholds that adjust to natural variations reduce false alarms [1][3][24].
A great example of this in action is LinkedIn’s "AlerTiger", deployed in June 2023. This deep-learning–based monitoring system identifies anomalies in both input features and output scores. Operating across most production models for over a year, it has caught issues that led to measurable improvements in business metrics [24][25]. To streamline responses, assign alerts based on ownership – data engineers handle pipeline issues, while data scientists address model decay. Include actionable details like trace IDs and runbooks to speed up troubleshooting. For critical issues, tools like Argo Workflows can automate rollbacks to a stable model version when accuracy drops significantly [10]. Automated alerts, combined with refined cohort analysis, help uncover hidden problems across user segments.
Cohort Analysis for Deeper Insights
Looking at aggregate metrics alone can mask localized failures. A model with 90% overall accuracy might perform poorly – say, only 60% – for new users or specific geographic regions [2][3]. Breaking down performance by factors like demographics, device type, traffic source, or recency can reveal hidden regressions. This is especially important for identifying bias or fairness issues that averages tend to obscure.
To monitor priority cohorts, statistical tools like the Population Stability Index (PSI) are useful. For high-stakes segments, such as those involving safety-critical decisions or high-value transactions, stricter thresholds should be applied. Shadow deployments – where old and new model versions run simultaneously for specific user groups – can help evaluate real-world performance differences before a full rollout [3][23]. To manage costs, sample a small percentage of requests for routine evaluation and increase the sample size only when alerts are triggered [23]. This approach balances thoroughness with efficiency, ensuring reliable insights without unnecessary expense.
Conclusion: Ensuring AI Reliability and Scalability
Summary of Key Challenges and Solutions
AI systems fail in ways that differ from traditional software. Even when infrastructure dashboards show no issues, AI models can drift, produce biased results, or generate inaccurate outputs. In fact, around 85% of machine learning (ML) deployments fail after leaving the lab due to model drift [26]. These failures often go unnoticed, quietly undermining business performance without setting off traditional error alerts. The non-deterministic nature of AI – where the same input may yield varying outputs – makes standard testing approaches inadequate, requiring constant monitoring in production environments [5][4].
Addressing these challenges involves implementing multi-layered monitoring that spans system health, data quality, model performance, and business KPIs. Automated anomaly detection, powered by statistical methods and adaptive thresholds, can flag potential problems early. By focusing on these areas, tailored solutions can effectively address the unique demands of AI systems.
How AlterSquare Supports AI Monitoring
AlterSquare’s AI-Driven & Generative AI Development services are designed to help startups build strong monitoring systems that account for the distinct needs of AI. Our engineering teams develop custom dashboards and integrate tools like MLflow and Prometheus directly into your architecture. This ensures comprehensive tracking across four essential layers: system health, data quality, model performance, and business outcomes. Through our Tech Team Augmentation services, we provide experienced engineers who specialize in both traditional software metrics and AI-specific indicators, such as embedding drift and token usage patterns.
For businesses updating existing AI systems, our Application Modernization & Legacy Recovery service adds advanced monitoring features to live products without disrupting ongoing operations. We implement capabilities like session-level tracing, automated evaluation pipelines, and safeguards against hallucinations in real-time. Additionally, our Software Consulting practice offers CTO-level guidance to balance monitoring depth with cost efficiency. For instance, using smaller language models for evaluations can cut costs by as much as 97% compared to full-scale large language models [5][26].
Next Steps for Founders and Product Teams
To ensure effective AI monitoring, founders should begin by identifying their most critical AI workloads and ranking them based on business impact. Establish baseline metrics during your next model deployment – track input distributions, prediction trends, and latency metrics. These benchmarks act as an early warning system for detecting gradual performance declines. Start with basic operational metrics like latency and error rates, then expand to include advanced checks for concept drift and bias as your product evolves [10].
When rolling out new models, use structured evaluation scores to gate releases and test new versions in shadow mode against live traffic. Set up smart alerts that provide actionable insights to the right team members – data engineers for pipeline issues and data scientists for model performance problems. Pay attention to subtle signals like latency shifts or changes in embedding consistency, as these often indicate upcoming accuracy issues hours or even days in advance [8]. By late 2024, 78% of organizations reported using AI in at least one area of their business [24]. Investing in robust monitoring now can help ensure that your AI systems remain reliable and maintain user trust, setting them apart from less successful implementations.
1.3. ML monitoring metrics. What exactly can you monitor?
FAQs
What’s the fastest way to detect model drift in production?
The quickest way to spot model drift in production is through automated monitoring systems. These tools keep an eye on key performance metrics and watch for shifts in data distribution as they happen. By using drift detection algorithms paired with alert systems, you can catch potential problems early, helping your AI models stay both accurate and dependable.
How can we monitor bias without real-time ground truth labels?
Monitoring bias without real-time ground truth labels is possible by keeping a close eye on model behavior and tracking how data distributions evolve. For instance, shifts in feature distributions or changes in bias-related metrics can act as red flags, signaling potential issues as they arise. To make this process easier and more consistent, tools and frameworks are available that automate the evaluation of both bias and performance over time. This approach helps maintain fairness and accuracy in the model’s output, even without immediate access to labeled data.
Which 5 metrics should we pick for an AI feature launch?
The five key metrics to focus on when launching an AI feature are model accuracy, data quality, model drift, bias detection, and real-time performance metrics like latency and throughput. These metrics are essential for maintaining an AI system that is precise, fair, and responsive, ensuring dependable performance while meeting your business objectives.


Leave a Reply