

When startups hit $2M ARR, growth often exposes hidden weaknesses in systems and processes. Here are the five most common areas that break and how to address them:
- Fragile Architectures: Early systems built for speed, not scale, struggle under increased traffic and team size. Warning signs include slower deployments, database lag, and high technical debt. Solutions: modular architecture, database optimization, and allocating 25% of development capacity to tech debt.
- Unmanaged Tech Debt: Ignored shortcuts from the early days slow down development and increase bugs. Warning signs: velocity decay, silent failures, and unclear ownership. Solutions: create a debt register, dedicate 20% of sprints to debt reduction, and modernize incrementally.
- Team Inefficiencies: Growing teams face communication bottlenecks, unclear ownership, and decision delays. Warning signs: "hero bottlenecks", scattered information, and misalignment. Solutions: introduce decision frameworks (e.g., RACI), document processes, and reorganize teams by product domains.
- CRM and Revenue Operations Breakdowns: CRMs fail as sales teams grow, causing data inconsistencies and forecast issues. Warning signs: shadow systems, manual processes, and pipeline visibility problems. Solutions: audit workflows, improve data quality, and modularize CRM systems.
- Performance and Infrastructure Bottlenecks: Infrastructure struggles with increasing demand. Warning signs: slow queries, resource imbalances, and cascading failures. Solutions: use observability tools, implement read replicas, and optimize database access patterns.
Key takeaway: Scaling doesn’t break systems – it reveals their limits. Addressing these issues early ensures smoother growth and fewer disruptions.
Scaling Startups & Tackling Tech Debt: Insights from Thanos Diacakis | TBCY
sbb-itb-51b9a02
1. Fragile Architectures
Fragile architectures are one of the five major challenges companies face when scaling past $2M ARR. Early-stage systems are often built to prioritize shipping features quickly, not to handle the demands of exponential traffic growth. Unfortunately, the same shortcuts that helped you secure initial customers can turn into serious liabilities as your user base and team expand. What once worked during steady growth begins to buckle under heavier loads.
Early Warning Signs
One of the first signs of trouble is velocity decay. Developers start spending 60–70% of their time fixing technical debt instead of building new features [1]. As Unthinkable Tech aptly described it:
"It’s like running with a backpack. Every feature adds another brick. We’re still running, but getting slower – and we can’t figure out which brick to take out." [8]
Database performance issues are another warning. CPU spikes and query response times jumping from 20 milliseconds to 4 seconds point to unoptimized queries or missing indexes [5][3]. These "vertical cliffs" are a clear indicator that your database isn’t prepared for even moderate growth. Background jobs can also begin failing silently, with problems surfacing only after customers report them [3].
Cognitive overload is another red flag. If onboarding a new developer takes months due to the need for excessive informal knowledge transfer, your system is likely too complex. When a codebase is a maze of temporary fixes that became permanent, it becomes nearly impossible for new team members to contribute effectively [4].
Impact on Scalability and Stability
These issues don’t just slow you down – they can destabilize your entire system. Tightly coupled monoliths, for example, can cause multiple system failures from a single bug fix [1][4]. Teams weighed down by technical debt are 2–3 times more likely to experience production incidents and deliver 25–50% fewer features compared to those with cleaner architectures [1].
Bence Roth, a software engineer, summed it up well:
"Scalability dies not from load, but from fear of change." [4]
When teams avoid refactoring or improving their codebase because every deployment feels risky, the architecture becomes untouchable – not because it’s strong, but because it’s fragile. This fear of change stifles progress and innovation.
Recommended Solutions
To address these challenges, focus on targeted architectural and operational changes. Start by reorganizing your architecture around business capabilities – like Billing, Identity, or Notifications – rather than technical layers such as Controllers or Repositories. This allows different parts of your system to scale independently [4].
For database issues, use read replicas to split read and write traffic. Sharding can also help isolate resource-heavy enterprise customers in multi-tenant SaaS environments [5]. Before upgrading hardware, audit slow queries and add indexing [2].
Dedicate 25% of your development capacity to tackling technical debt [1]. This isn’t just a nice-to-have – it’s essential to keep debt from outpacing growth. Additionally, implement an API Gateway to centralize tasks like authentication, rate limiting, and logging, keeping these functions separate from your core business logic [5].
Relevant Tools and Frameworks
Tools for observability can make a big difference. Sentry is great for error tracking, while Datadog and New Relic provide distributed tracing to identify which SQL queries slow down under load [5][7]. On the frontend, Feature-Sliced Design (FSD) organizes code by business domains, and libraries like React Query or TanStack Query streamline server-side state management [1]. For monorepo setups, tools like Nx and Turborepo offer build caching and enforce clear architectural boundaries [1].
Real-world examples show the impact of these strategies. In January 2024, API management company Kong adopted a micro-frontend architecture, cutting their PR-to-production time from 90 minutes to 13 minutes and nearly doubling their weekly deployment frequency. Similarly, security company Sqreen reduced critical production errors from 10 per week to just a few per year by enforcing automated testing and consistent code standards with tools like ESLint and Prettier [1]. These behind-the-scenes improvements ensure your system stays reliable – even when you’re not watching.
2. Unmanaged Tech Debt
Unchecked tech debt can cripple a startup’s ability to grow and adapt. While tech debt itself isn’t inherently bad – it can even be a useful tool – the real trouble begins when it’s ignored after being taken on for short-term gains. As Ward Cunningham, co-author of the Agile Manifesto, famously said:
"Shipping first-time code is like going into debt. A little debt speeds development so long as it is paid back promptly with refactoring. The danger occurs when the debt is not repaid." [10]
For startups hitting $2M ARR, unresolved tech debt can become a major bottleneck. Fragile architectures might destabilize systems, but unmanaged tech debt drags down development speed, making it harder to deliver new features and maintain momentum.
Early Warning Signs
Velocity decay is one of the first indicators. Features that once took two days to build might now take four, slashing productivity by half [10]. Developers often find themselves spending 60–70% of their time fixing and maintaining old code instead of creating new solutions. This frustration can lead top talent to leave for better opportunities.
Another red flag is silent failures. Background jobs might stop working without any alerts, database queries could time out under heavy loads, and over-reliance on AI-generated code without proper oversight might lead to bloated file sizes and a spike in duplicate code – from 3.1% to 14.2% [3][10].
As teams grow, unclear ownership can also become a problem. Questions like "Who owns this?" arise during standups, and deployments turn into a game of roulette as no one knows what might break. When onboarding new developers takes months due to undocumented shortcuts and tribal knowledge, tech debt has moved from being a minor nuisance to a major structural issue.
Impact on Scalability and Stability
Unmanaged tech debt can consume up to 40% of an engineering team’s capacity [10], leaving little room for innovation. Studies show that 60–80% of software budgets often go toward maintenance rather than creating new features [1]. Systems weighed down by debt are also 2–3 times more likely to experience production incidents [1].
The consequences can be dire. Take the case of Knight Capital Group in August 2012: a deployment error involving outdated legacy code cost the company $440 million in just 45 minutes, forcing it into an acquisition [10]. Even if your startup doesn’t face such catastrophic losses, persistent tech debt can lead to performance issues, increasing customer churn rates by 20–30% [11].
Victor Quinn, CTO of Texture, summed it up perfectly:
"Technical debt is exactly like financial debt. It’s not moral. It’s not a sin. It’s a tool. Used well, it gives you leverage. Used poorly, it slowly kills you." [10]
The difference between startups that scale and those that stall often lies in how they manage this debt. Intentional debt – like hard-coding a feature to test market fit – is planned and documented, while accidental debt comes from poor coding practices, knowledge gaps, or high turnover [10]. Interestingly, startups that manage their debt strategically have a 60.6% funding success rate, compared to 44.4% for those with "cleaner" but slower-moving codebases [10].
Recommended Solutions
Dealing with tech debt requires transparency and discipline. Start by making debt visible. Create a debt register – a shared list that tracks affected areas, risk levels (low/medium/high), and the estimated effort needed to fix them [10]. This ensures quick fixes don’t turn into long-term landmines.
Implement the 20% rule: dedicate 15–25% of every sprint to addressing tech debt. Focus on the "hot paths" – the 20% of code responsible for 80% of bugs [10]. This isn’t wasted time; it’s an investment that prevents debt from spiraling out of control. Teams that prioritize debt reduction often deliver more features compared to those stuck in maintenance mode [1].
For architectural debt, use the Strangler Fig Pattern. Instead of attempting risky full-system rewrites, build new systems alongside old ones and gradually transition traffic to the updated components. Texture successfully used this approach to migrate from Render to AWS, slashing SOC 2 audit costs by 7× while maintaining uptime [10].
To prevent issues with AI-generated code, enforce AI oversight during code reviews. Require developers to explain the purpose and trade-offs of any AI-generated code in pull requests. If they can’t, that code shouldn’t ship [10]. This step ensures the code isn’t just functional but also sustainable.
Relevant Tools and Frameworks
Several tools can help you manage tech debt effectively:
- Code Analysis: Tools like SonarQube, ESLint, Prettier, and jscpd can identify code smells, complexity, and duplication early [10]. Snyk and Dependabot help catch vulnerabilities in dependencies [12].
- Observability: Platforms like Sentry track production errors, while Datadog and New Relic provide insights into root causes [5]. Betterstack offers structured logging and uptime monitoring [3].
- Performance and Infrastructure: Lighthouse and Webpack Bundle Analyzer monitor Core Web Vitals and catch bundle bloat [1]. Docker and Kong simplify containerization and handle concerns like authentication and rate limiting [5].
The benefits of these practices are clear. In January 2024, Kong adopted a micro-frontend architecture to address monolithic tech debt. This reduced their PR-to-production time from 90 minutes to just 13 minutes and nearly doubled their weekly deployment frequency [1]. Managing tech debt strategically doesn’t slow you down – it accelerates progress.
3. Team Inefficiencies
When your startup grows past $2M ARR, the dynamics of your team shift dramatically. That scrappy five-person crew, once thriving on gut instincts and quick decisions, morphs into a 20-person operation where coordination becomes a major challenge. The issue isn’t about talent – it’s the exponential increase in communication paths. A five-person team has just 10 possible conversation channels, but a 20-person team? That jumps to 190 [13]. Once you surpass 20 developers, a flat structure can lead to engineers spending up to half their week syncing with others instead of focusing on meaningful work [13]. These challenges often show up early as specific behaviors that highlight inefficiencies.
Early Warning Signs
One clear indicator is when phrases like “I thought someone else was handling that” start popping up in Slack or during standups [15]. Decision-making can spiral into endless loops as accountability blurs. Another red flag? The “hero” bottleneck – where a few generalists hold all the critical knowledge, forcing every decision to depend on them [15, 18].
Information also tends to scatter across various channels, leaving teams to operate on conflicting assumptions because initial decisions weren’t documented [14]. Teams may begin optimizing only for their own goals, duplicating efforts because they’re disconnected from the company’s broader objectives. Feedback mentioning “misalignment” has surged by 149% year-over-year, reflecting this growing fragmentation [15].
Impact on Scalability and Stability
These inefficiencies hit particularly hard when combined with fragile tech architectures and lingering technical debt. They don’t just slow progress – they limit your company’s ability to grow. As businesses scale from 50 to 200 employees, decision-making speed can drop by 50% without intentional changes [15]. Even if revenue continues climbing, internal productivity – measured by decision speed, issue resolution, and deployment frequency – often takes a hit [18]. Mira Vora, a Business Transformation Strategist at Pepshep, sums it up well:
"Growth rarely collapses because the plan is wrong. It collapses because the people system fractures under pressure." [18]
Adding more people to a chaotic system doesn’t fix it – it amplifies the existing problems [19, 21]. For example, cross-functional conflicts between Sales and Operations often stem from poor “handoff architecture,” not a lack of talent [17]. Another overlooked factor is management quality. Managers account for 70% of the variance in team engagement [15], yet startups frequently delay building proper coaching systems for them until it’s too late.
Recommended Solutions
To tackle these inefficiencies, start by introducing clear decision-making frameworks and structured communication. Tools like DACI (Driver, Approver, Contributor, Informed) or RACI can help assign ownership and cut down on endless meeting cycles [14]. Shift from a culture of consensus to one of clarity – where not everyone has to agree, but everyone knows who’s accountable. CEOs should avoid being the bottleneck for operational decisions and delegate authority to the lowest responsible level.
As your engineering team grows beyond 15–20 developers, it’s time to move away from a flat structure. Organize around defined product domains, separating core product development from client-specific work to keep your roadmap focused [13]. Follow a clear progression: Document, Standardize, Automate, and then Delegate [19]. Encourage lightweight documentation practices like weekly updates, decision logs, and one-page process notes [14].
Founders should focus on systems that push decision-making downward [20, 21]. As Aventus wisely notes:
"Scaling doesn’t create operational problems – it reveals the ones already there." [19]
Relevant Tools and Frameworks
Just like technical metrics help maintain system stability, organizational tools can improve team efficiency. Frameworks like DACI or RACI reduce friction by clarifying roles [14]. Automate tasks with CI/CD pipelines (e.g., GitHub Actions) to eliminate deployment delays [3]. Use monitoring tools like Sentry to free up engineering time by replacing manual oversight [3]. Track metrics like Mean Time to Recovery (MTTR) and deployment frequency to gauge organizational health – not just output [4].
Keep an eye on cloud and API costs relative to revenue to identify scaling issues before they spiral [3]. And don’t wait until you hit 100 employees to invest in manager coaching. Managers play a critical role in team engagement, and without strong feedback systems, it can take over six months to identify disengaged employees [15]. Build those feedback loops now to stay ahead.
4. CRM and Revenue Operations Breakdowns
CRMs that once worked well for small teams often struggle when sales teams grow beyond 8–10 reps. The first red flag? Your finance team starts building their own spreadsheets because they no longer trust the CRM data [21]. Bookings and billings start to diverge, and tracking revenue by cohort becomes a manual, time-consuming process [21]. These signs are clear indicators that your revenue systems need attention before the cracks turn into major issues.
Early Warning Signs
When your sales team grows past 8–10 reps, pipeline visibility tends to fall apart [22]. What used to run smoothly with intuition and quick Slack chats becomes chaotic and unpredictable. Leadership finds it harder to track deals, and forecasts swing wildly due to inconsistent pipeline definitions [24]. Board meetings get uncomfortable when you can’t explain the numbers with confidence. If your sales reps start creating "shadow systems" in Google Sheets to fill CRM gaps, it’s a sign that trust in your data is eroding [22].
Impact on Scalability and Stability
Breakdowns in revenue operations reveal a harsh reality:
"Revenue is not proof of a revenue system" [23].
As internal coordination issues grow faster than headcount, even small changes can disrupt point-to-point integrations [20]. Sales teams begin missing follow-ups, quoting delays become common, and win rates start to decline [20]. Meanwhile, support teams lose ticket context, leading to longer handle times and a dip in customer experience. On top of that, system outages can cost around $9,000 per minute, with each crash requiring an average of 22 minutes to recover [20].
Recommended Solutions
Addressing CRM breakdowns requires early action and ongoing system reviews. Here’s how to get started:
- Fix data consistency before implementing automation to avoid magnifying existing errors [24].
- Align marketing, sales, and customer success teams by defining shared funnel stages and handoff expectations [24].
- Document your revenue workflows – how a deal progresses to recognized revenue – before mapping technical fields during migrations [21].
- At critical growth points, such as 8–10 reps, $10M ARR, or 50 employees, audit your tech stack and upgrade as needed [22].
- Know your system limits. For example, HubSpot Professional may hit a ceiling at Series B, requiring a migration to Enterprise for advanced features like custom reports [22].
- Design your CRM system modularly, like "LEGO blocks", using API-led connectivity. This approach allows you to update individual components without disrupting the entire system [20].
Relevant Tools and Frameworks
- The Four-Pillar RevOps Framework focuses on People (roles and alignment), Process (workflows and SLAs), Technology (stack and automation), and Data (governance and quality) [25].
- Your CRM should act as the single source of truth – tools that create data silos only add friction [25].
- Strive for 90%+ completeness and 85%+ accuracy in your active pipeline records [25].
- A good rule of thumb: hire one dedicated RevOps specialist for every 10–15 Go-To-Market employees [22].
- To modernize legacy systems without disrupting revenue, use the "strangler pattern", which lets you replace old modules incrementally rather than attempting a risky full rewrite [20].
5. Performance and Infrastructure Bottlenecks
Performance bottlenecks can quietly strain the infrastructure that supports your growth. Unlike team or tech debt challenges, these issues often emerge subtly – like a database connection pool that no longer scales as your application servers expand, or a slight dip in cache efficiency causing significant database slowdowns [26]. Terms like asymmetric resource consumption (uneven resource usage) and coupled metric drift (metrics declining together) describe these warning signs. Even if your dashboards show all green, such patterns suggest your infrastructure is nearing its limits.
Early Warning Signs
The trickiest bottlenecks are often the hardest to spot. For example, a team might accept a 2% weekly error rate during maintenance as "normal", but these small anomalies can signal larger issues waiting to surface [26]. Keep an eye on metrics that tend to move in sync – when one part of the system falters, others may quickly follow. As one expert wisely put it:
"Watch the slope, not the spike." – Pillars [26]
Instead of focusing solely on hard thresholds, monitor how quickly resource usage changes over time. For instance, tracking the weekly growth in database connections can help you identify issues before they escalate. Catching these problems early is essential to avoid cascading failures across your system.
Impact on Scalability and Stability
Just like unmanaged tech debt or fragile architectures, infrastructure bottlenecks can silently erode stability and hinder growth. These performance issues don’t just slow down your system – they amplify other challenges. Research shows that technical debt can make up as much as 40% of an IT budget, and systems burdened with it are 2–3 times more likely to experience production incidents [1]. Teams dealing with high levels of debt often deliver 25–50% fewer features compared to teams with cleaner systems [1].
A real-world example: In January 2024, Kong transitioned to a micro-frontend architecture to resolve monolithic bottlenecks. This change reduced their PR-to-production time from 90 minutes to just 13 minutes and nearly doubled their weekly deployment frequency [1]. When your infrastructure struggles to keep pace, your product’s overall velocity takes a hit.
Recommended Solutions
To tackle performance bottlenecks, start by auditing your system with observability tools like Datadog, Sentry, or New Relic. These tools can help you pinpoint why a request is slow – not just that it’s slow [5]. Offload cross-cutting concerns like authentication and rate limiting to API gateways (e.g., Kong, AWS API Gateway, or Nginx), allowing your application code to focus on core business logic [5]. Implement read replicas to distribute database load more effectively.
Load testing tools such as k6, Gatling, or Locust can simulate production traffic to identify weak points [9]. Circuit breakers between services are another safeguard, preventing a single slow dependency from causing system-wide failures [9][2].
Relevant Tools and Frameworks
To standardize your approach, use OpenTelemetry for structured logs, metrics, and traces across your systems [27]. Tools like Lighthouse can monitor Core Web Vitals and help you set performance budgets for your frontend [1]. For monorepo management, consider Nx or Turborepo to streamline builds with caching [1]. Use EXPLAIN plans to analyze ORM SQL and address inefficiencies in data access patterns [9][2]. Finally, organize your codebase around business capabilities – like Billing or Identity – rather than technical layers. This allows performance-critical components to scale independently [4].
Before and After: Metrics That Change When You Fix These Problems
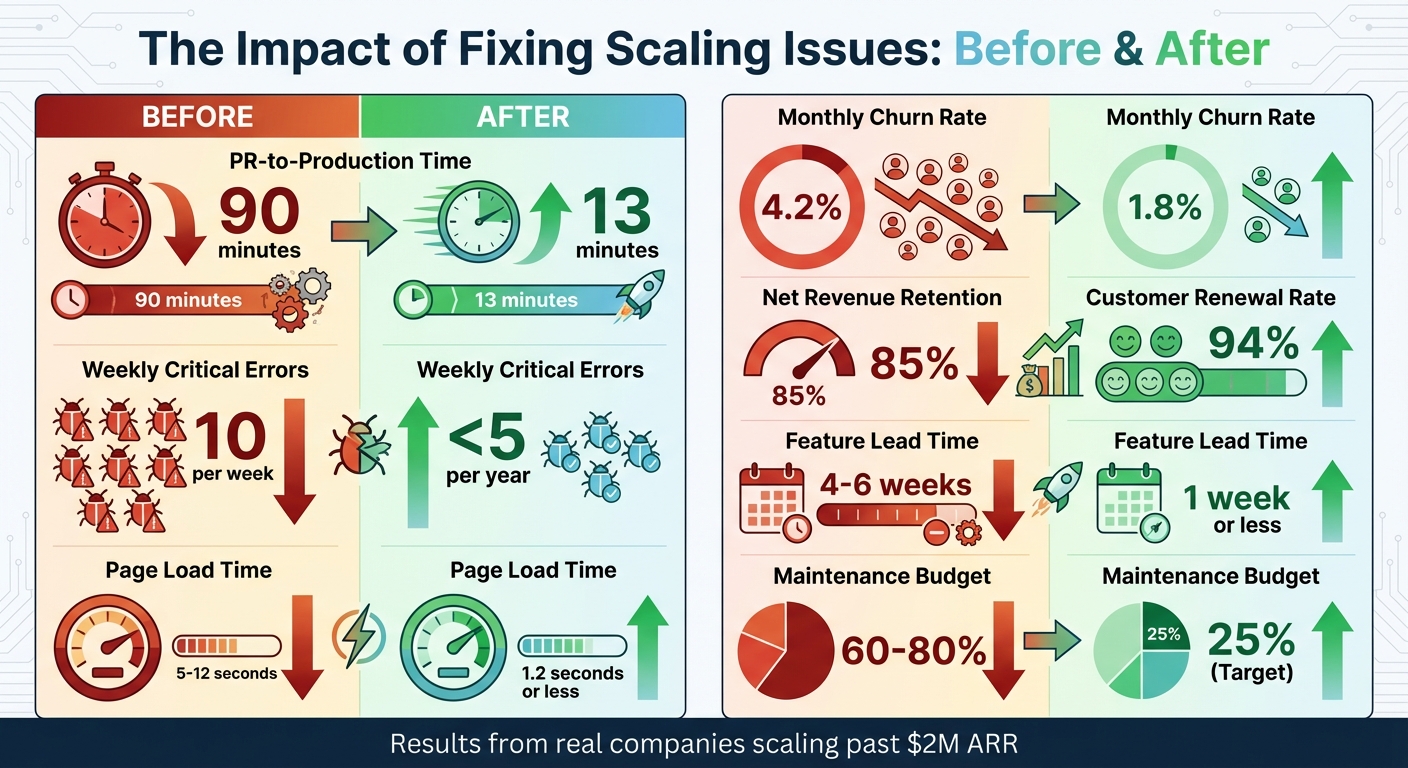
Before and After Metrics: Impact of Fixing Startup Scaling Issues
Numbers don’t lie – fixing system issues leads to dramatic results. Take Kong, for example. After switching to a micro-frontend architecture in January 2024, their PR-to-production time plummeted from 90 minutes to just 13 minutes. They also nearly doubled their weekly deployment frequency [1]. Similarly, Sqreen saw a huge drop in weekly critical errors, going from 10 per week to fewer than 5 per year, thanks to automated testing and mandatory linting [1].
Improvements in revenue operations can also drive major outcomes. Hubstaff, for instance, revamped their Customer Success (CS) approach during their growth from $4M to $30M ARR. By shifting from reactive support to proactive engagement, they raised their renewal rates from 82% to 94% and achieved a 40% year-over-year boost in expansion revenue [28]. Another example comes from a B2B marketing automation platform with $6M ARR. Faced with a churn crisis – net revenue retention (NRR) was stuck at 85%, and monthly churn hit 4.2% – they restructured their CS team and aligned Sales and CS on the first 90 days of the customer journey. The result? Monthly churn dropped to 1.8%, and NRR climbed to 112% [28].
Here’s a snapshot of the improvements:
| Metric | Before Fixing | After Fixing |
|---|---|---|
| PR-to-Production Time | 90 minutes | 13 minutes [1] |
| Weekly Critical Errors | 10 per week | <5 per year [1] |
| Page Load Time | 5–12 seconds | 1.2 seconds or less [6] |
| Monthly Churn Rate | 4.2% | 1.8% [28] |
| Net Revenue Retention | 85% | 112% [28] |
| Customer Renewal Rate | 82% | 94% [28] |
| Feature Lead Time | 4–6 weeks | 1 week or less [6] |
| Maintenance Budget | 60–80% | 25% (Target) [1] |
These numbers highlight how quickly improvements can take shape – sometimes in just weeks. For example, teams that establish clear KPI ownership and weekly operating cadences often see measurable results within 4–6 weeks [29]. Optimizing databases can cut page load times in half within days [3]. To tackle issues effectively, start with monitoring and alerts, then move on to database performance, cost audits, and CI/CD enhancements [3].
The takeaway? Tackling system inefficiencies early pays off, delivering measurable results before scaling challenges spiral out of control.
Conclusion
The five breakdowns discussed earlier highlight how scaling success can expose hidden weaknesses in your systems. When a company grows beyond $2M ARR, it’s not necessarily a sign of a flawed product – it’s a stress test for your infrastructure [4]. Systems that worked seamlessly during the early stages often falter under the weight of added features, expanding teams, and growing data demands. Fragile architectures, unmanaged tech debt, team inefficiencies, CRM breakdowns, and infrastructure bottlenecks aren’t rare exceptions – they’re the inevitable result of delaying structural improvements until it’s too late.
Consider this: unmanaged technical debt can consume up to 80% of your software budget [1]. Teams overwhelmed by this debt produce 25–50% fewer features compared to high-performing teams [1]. And as change velocity increases, technical debt grows exponentially. This often leads to what engineers call the "Year-Two collapse", where every attempt to refactor becomes a high-risk endeavor [4]. Tareef Jafferi, CEO of Happily.ai, sums it up perfectly:
"The infrastructure for 200 people gets built at 50. By the time you need it, it’s too late to build it well." [15]
Addressing these breakdowns early not only maintains your operational speed but also turns structural hurdles into opportunities for sustainable growth. Tools like AI-Agent Assessments and Traffic Light Roadmaps can help identify and prioritize risks. These assessments focus on architectural coupling, performance bottlenecks, and security vulnerabilities, while the Principal Council adds a business perspective to create a roadmap tailored to your growth stage.
The aim isn’t perfection – it’s managing debt effectively. By dedicating just 25% of your development resources to handling technical debt, you can prevent it from spiraling out of control [1]. Phased modernization, starting with formatting, followed by best practices, and finally architectural updates, allows you to stabilize legacy code without halting feature development [16]. A focused four-week sprint to optimize databases, harden CI/CD pipelines, and enhance monitoring can yield quick wins – like halving page load times – in just a matter of days [3].
The growing pains you experience during scaling are a clear signal of underlying structural issues [30]. Address those foundational problems now, and you’ll pave the way for predictable, sustainable growth. Ignore them, and you’re setting yourself up for a year of avoidable crises.
FAQs
How can I tell if we’re facing $2M ARR scaling issues or just a temporary setback?
If your business is hitting the $2M ARR mark and you’re noticing recurring issues like sluggish performance, hefty maintenance expenses, or infrastructure bottlenecks, these are likely signs of scaling challenges. These problems tend to persist and point to underlying system limitations. On the other hand, occasional hiccups are often tied to short-term circumstances and don’t necessarily reflect deeper structural weaknesses. The key is to identify patterns – if inefficiencies keep cropping up, it’s time to address the root causes.
What should we fix first if architecture, tech debt, and infra issues are all showing up at once?
When you’re dealing with architecture challenges, tech debt, and infrastructure issues all at once, the first priority should be fixing the core architecture. Begin by consolidating and clearly defining the boundaries of your business domains. This step helps stabilize your systems and makes them easier to scale. By addressing the architecture first, you create a solid foundation that makes it easier to handle other problems down the line.
When is it time to hire RevOps or add dedicated engineering owners for domains?
When your company hits approximately $2 million in Annual Recurring Revenue (ARR), it’s a good time to think about bringing on RevOps professionals or dedicated engineering owners. Why? At this point, businesses often encounter operational hurdles like pipeline visibility gaps, data quality issues, and fragile system architectures. These challenges demand skilled experts who can tackle them head-on and ensure smooth operations as you scale.


Leave a Reply